Friday, February 28, 2020

Answer for Expected payoff calculation

https://365datascience.com/dwqa-answer/answer-for-expected-payoff-calculation-2/ -

Hey Iurii, 

Thanks for reaching out!

Okay, so the idea here is that you’ve struck a deal, where you have the option (but not the obligation) to buy the shares at the given price. Hence, if the price goes down, then we’re better off just purchasing the stocks at their market value ($1,000), rather than the price we agreed upon earlier ($1,100). Hence, in the second scenario we only have a loss of $100 (the premium), rather than $1,100 ( 10 * $100 losses on shares + $100 loss on the premium). 

Hope this helps!

Best, 

365 Vik


#365datascience #DataScience #data #science #365datascience #BigData #tutorial #infographic #career #salary #education #howto #scientist #engineer #course #engineer #MachineLearning #machine #learning #certificate #udemy

Answer for Expected payoff calculation

https://365datascience.com/dwqa-answer/answer-for-expected-payoff-calculation/ -

Hey Iurii, 

Thanks for reaching out!

Okay, so the idea here is that you’ve struck a deal, where you have the option (but not the obligation) to buy the shares at the given price. Hence, if the price goes down, then we’re better off just purchasing the stocks at their market value ($1,000), rather than the price we agreed upon earlier ($1,100). Hence, in the second scenario we only have a loss of $100 (the premium), rather than $1,100 ( 10 * $100 losses on shares + $100 loss on the premium). 

Hope this helps!

Best, 

365 Vik


#365datascience #DataScience #data #science #365datascience #BigData #tutorial #infographic #career #salary #education #howto #scientist #engineer #course #engineer #MachineLearning #machine #learning #certificate #udemy

Thursday, February 27, 2020

How To Duplicate Sheets in Tableau?

https://365datascience.com/duplicate-sheets-tableau/ -

Duplicate Sheets in Tableau


In our last tutorial, we created the visualization showing us the 2016 GDP of each country. You can easily see it in the workspace area. What we’ll do here is add a similar visualization, but for ‘2015’ and expressing ‘GDP figures’ as a percentage of a total.


Which is the Fastest Way to Do That?


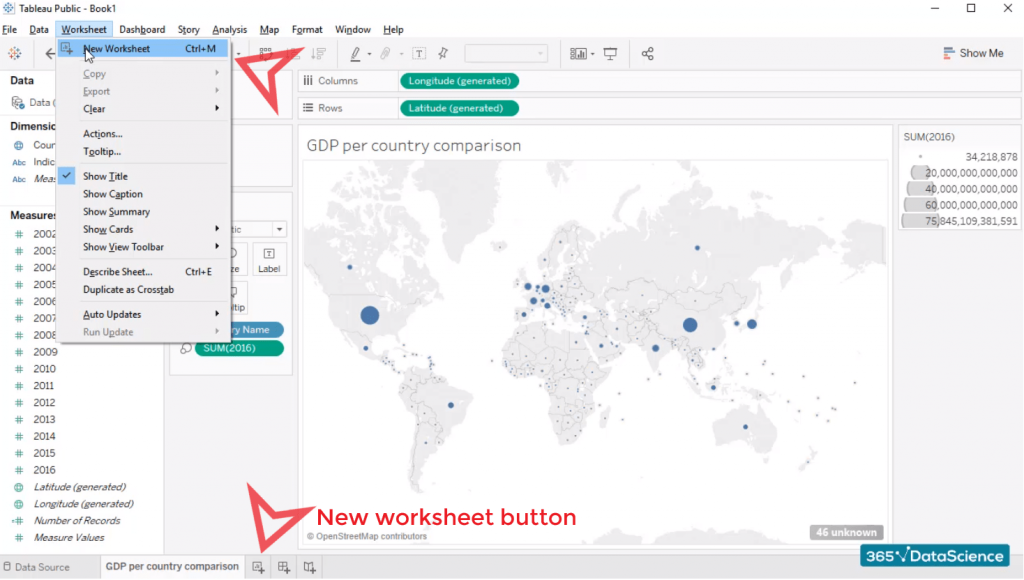
You can either press the “add new worksheet” button or go to “Worksheet”, select “New worksheet” and create a new blank sheet.


new worksheet in Tableau, duplicate sheets in tableau


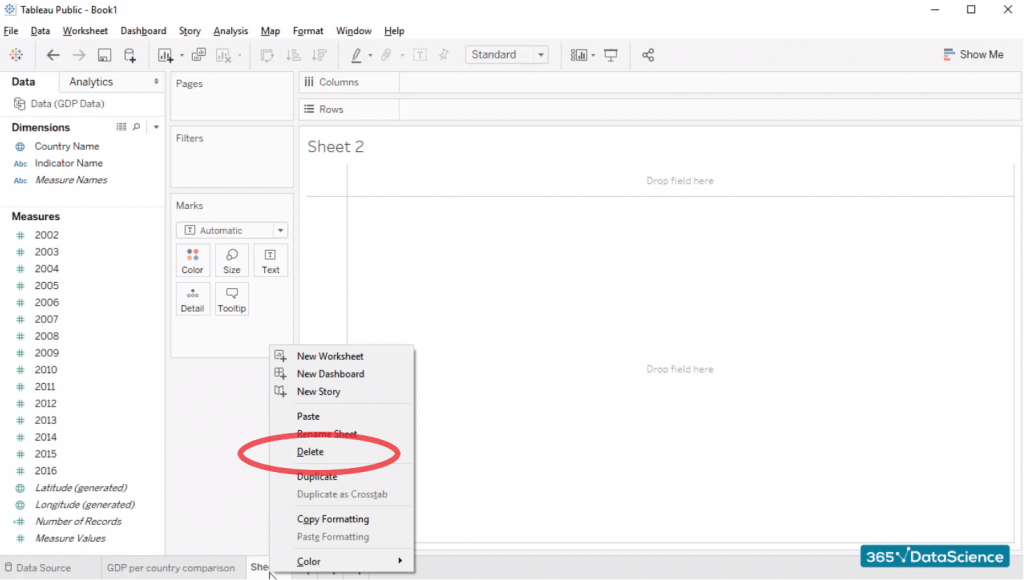
But sometimes that may not be the best possible solution, as we will lose many of the edits we have already made, right? So, we’ll delete the empty sheet we created. Now all you need to do is right-click and press “Delete” … And the redundant sheet’s gone.


Option "delete", duplicate sheets in tableau


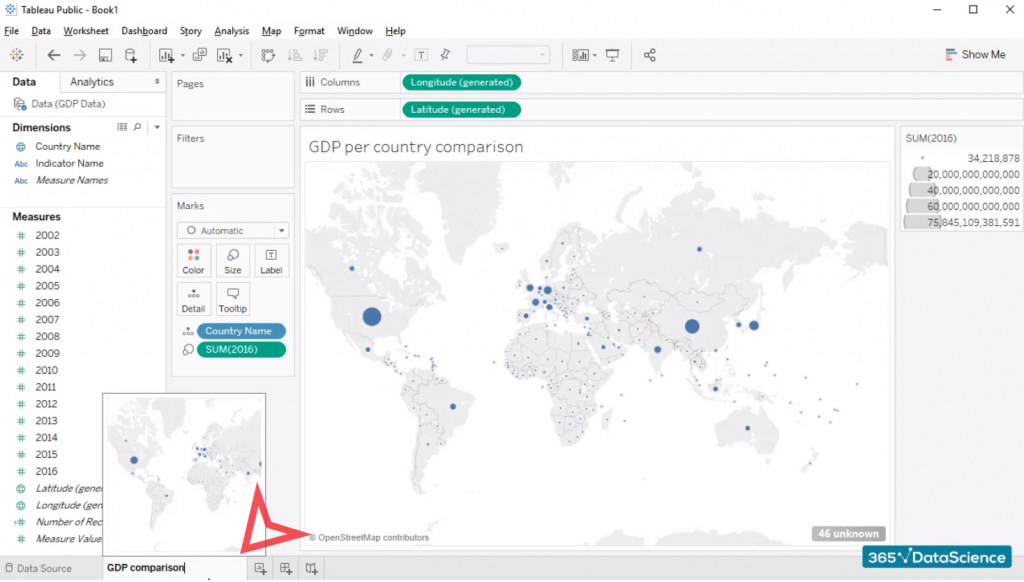
By the way, it is really easy to change a sheet’s name. Just double click on it and then type the sheet’s new name – “GDP comparison”.


That’s it!


Rename sheet


How to Duplicate Sheets in Tableau?


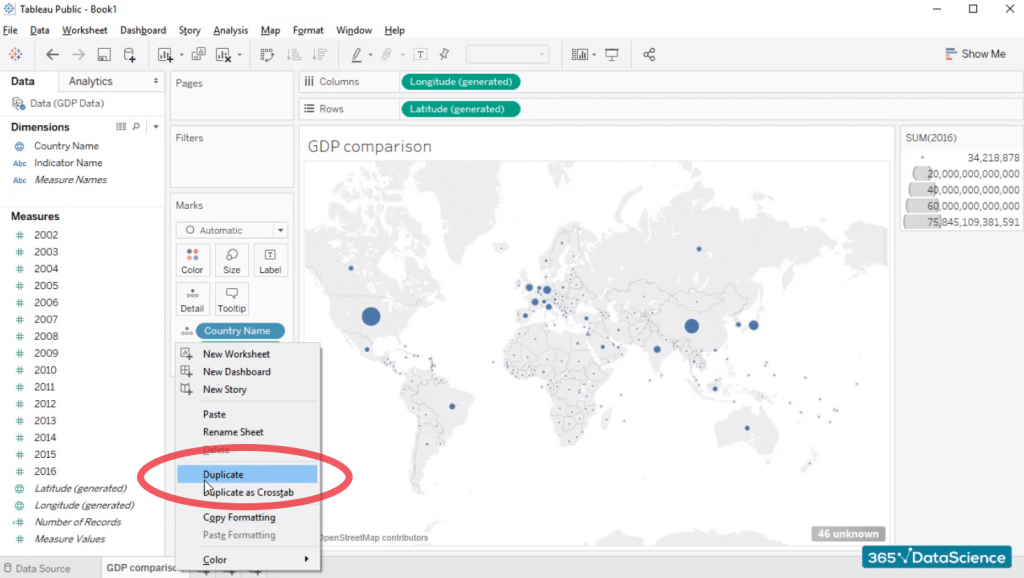
Let’s start with the previous visualization we created. You can use the “Duplicate” button to create an identical sheet to the one we saw earlier.


Duplicate a sheet, duplicate sheets in tableau


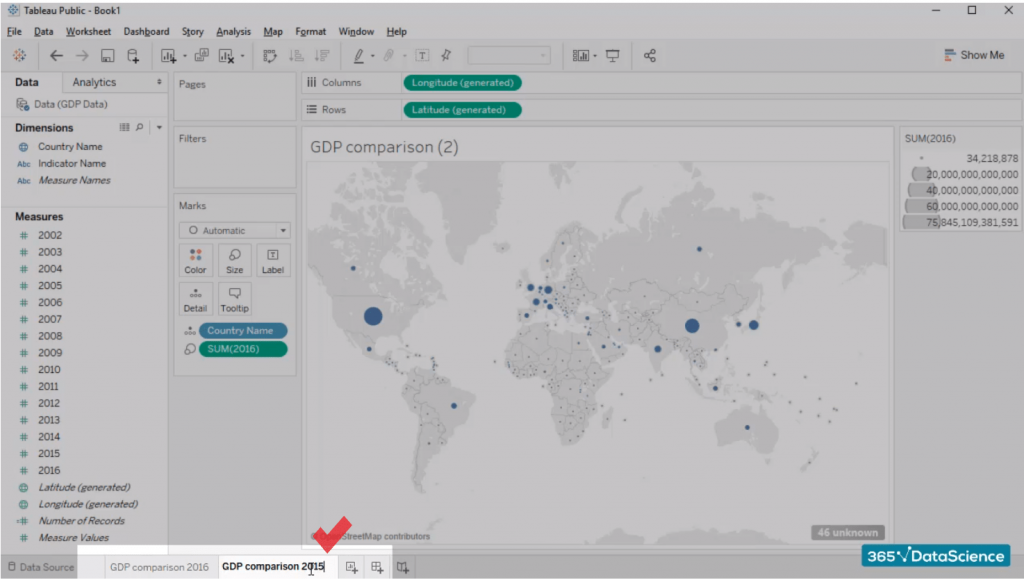
Next, you need to change the titles of the two sheets. The first one will be “GDP comparison 2016”, and the second one “GDP Comparison 2015”. You already know how to do that. While adjusting names, you can change the title of the first visualization accordingly – “GDP Comparison 2016”. And you can do the same for the visualization on the next sheet – “GDP Comparison 2015”.


Changing name field


GDP comparison 2015


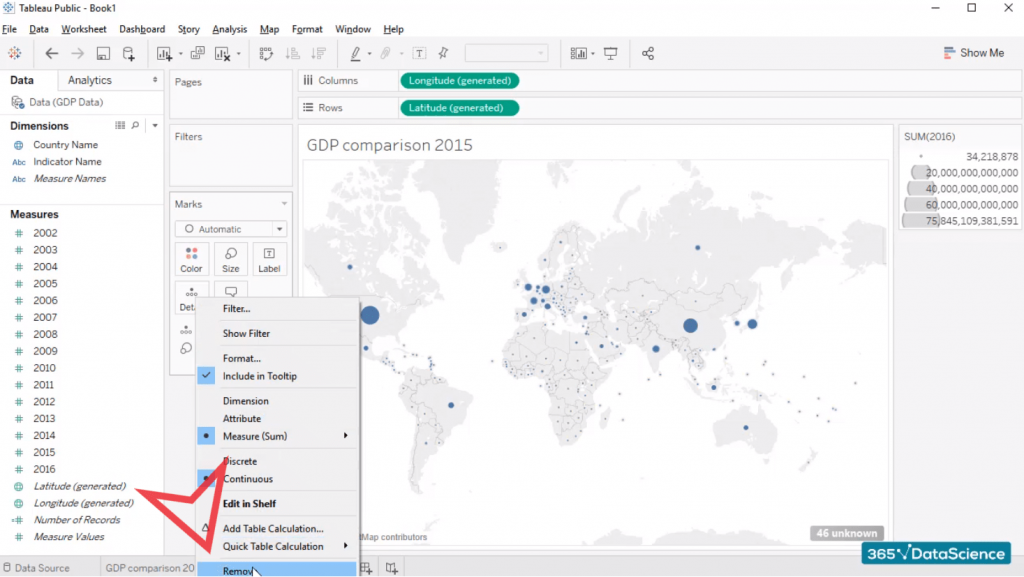
Let’s delete the 2016 data. To do that, click on the “SUM(2016)” field and press “Remove”. Now all circles have the same size because we removed the differentiating factor – GDP size. The reason we see “SUM” here is that Tableau needs to run some sort of math operation with the 2016 column of data it found in Excel. It says it sums the data, but what it really does is find the one field which corresponds to the United States and “sum” all values related to it (there is just one value corresponding to both United States and 2016). So, for those of you who are familiar with Excel, Tableau performs an operation like SUMIF in this case.


Remove field, duplicate sheets in tableau


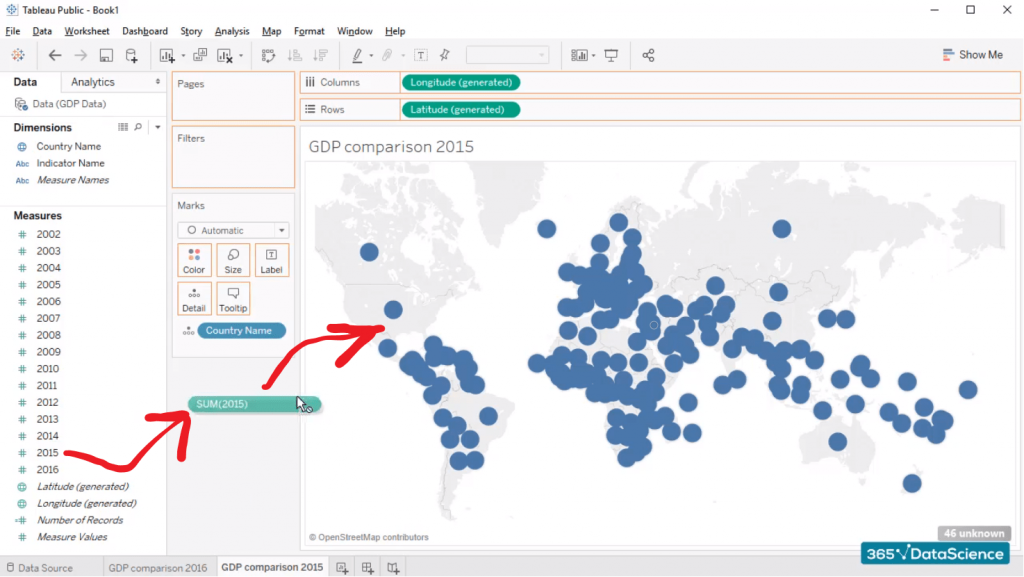
Let’s add 2015. That’s easy to do, isn’t it? You just have to drag the “2015” field in the workspace area.


drag and drop, duplicate sheets in tableau


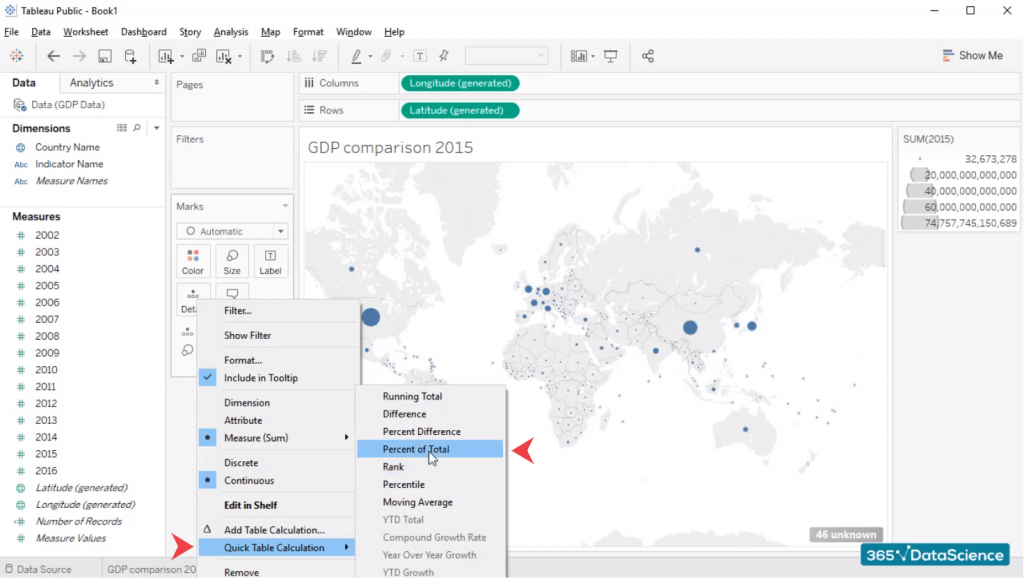
Now, as we said, we would like to display each country’s GDP as a percentage of the total GDP observed in 2015. So, click on the tiny arrow next to the 2015 field, go to “Quick table calculation” and select “percent of total”.


percent of total, duplicate sheets in tableau


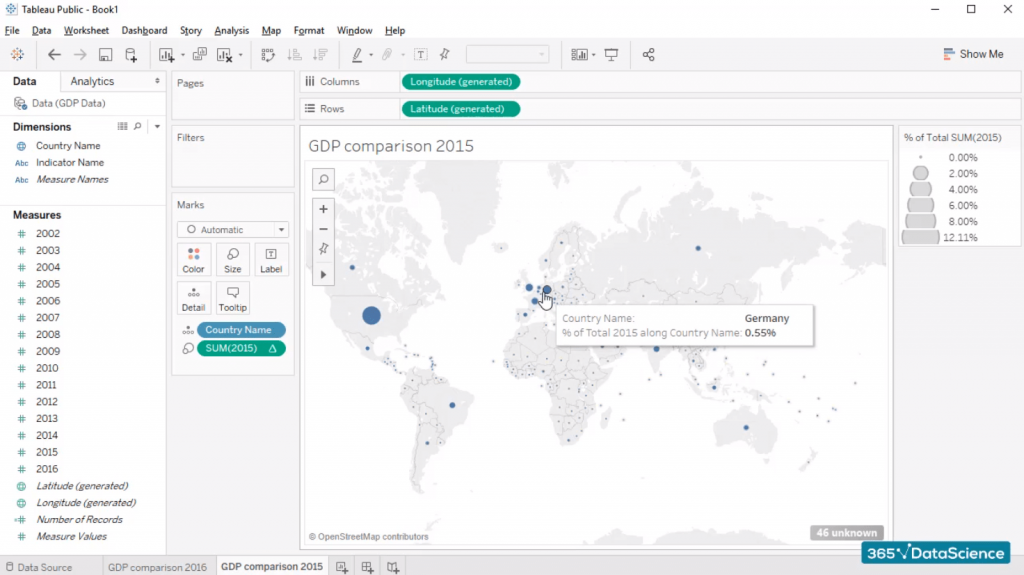
And of course, if we hover over the bubble of a given country, we’ll be able to see the percentage of the total world economy it accounts for. The United States represented almost 3% of the entire global economy. China produced 1.8% of the global output, and Germany accounted for 0.55%.


GDP per country, duplicate sheets in tableau


What an informative visualization! Plus, it looks so professional!


In our next tutorials, we will learn how to create a table with some custom fields and how to add a calculation to a table. It sounds fantastic, doesn’t it?


Warm up your fingers and mousepads and continue enjoying our Tableau tutorials!


data science training


#Tableau
#365datascience #DataScience #data #science #365datascience #BigData #tutorial #infographic #career #salary #education #howto #scientist #engineer #course #engineer #MachineLearning #machine #learning #certificate #udemy

How to Create a Chart in Tableau?

https://365datascience.com/create-chart-tableau/ -

Are you excited to create a chart in Tableau?


As you already know, Tableau is an absolutely wonderful, highly intuitive software that is easy-to-understand even for beginners. In this tutorial, we will show you one of a variety of data visualization tools you can choose from. Moreover, you’ll be able to create your first chart in Tableau very quickly – just by dragging and dropping the relevant objects you see on the interface.


Having said all that, I am sure you are eager to create some fascinating visualizations.


To create a chart in Tableau, let’s load an Excel file in Tableau


First off, we need to learn how to connect Tableau with the data source we will be working with. There are two options. We can either make a connection to a file or to a server. Of course, we will choose one of the options depending on where the data is. Let’s connect Tableau to this Microsoft Excel file. This file is called GDP data. If you are new to Tableau, or you haven’t read our previous tutorial, you can learn how to load the file and get rid of the empty rows.


Let’s open the GDP Data Excel file for a second to make sure you are familiar with its structure.


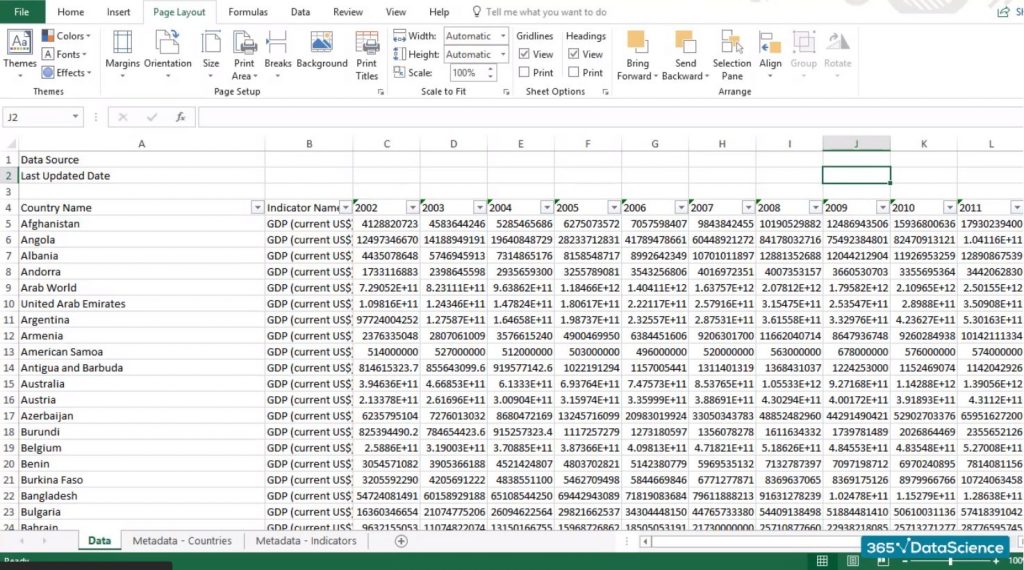
Here it is. We have a few blank rows, then we have a column with country names, a column indicating that this is GDP data, and several columns with GDP figures for each of these countries. And this is the Datasheet we are using right now.


tableau-database


Working with the source file


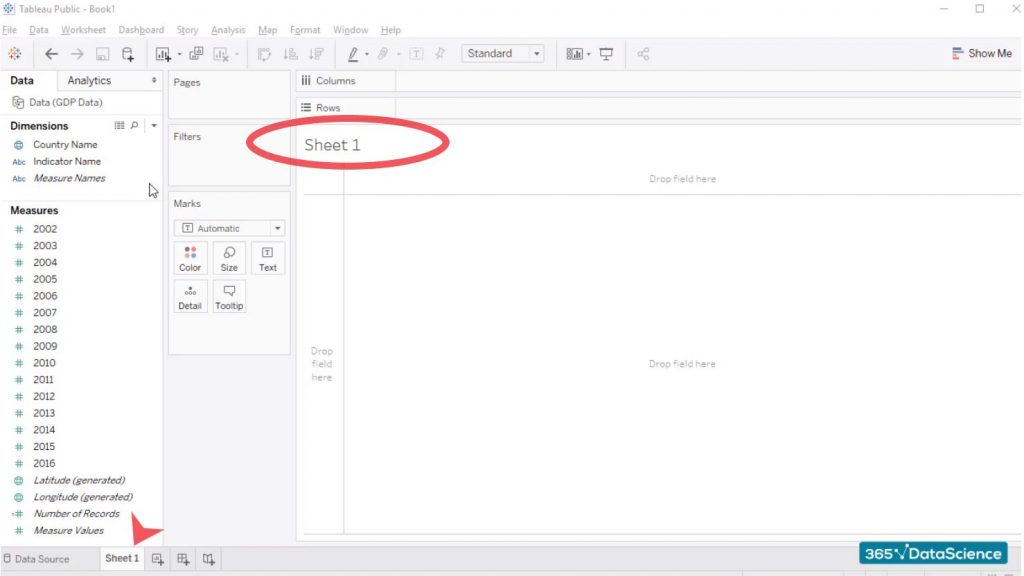
Let’s go back to Tableau and click on “Sheet 1.


tableau-sheet 1


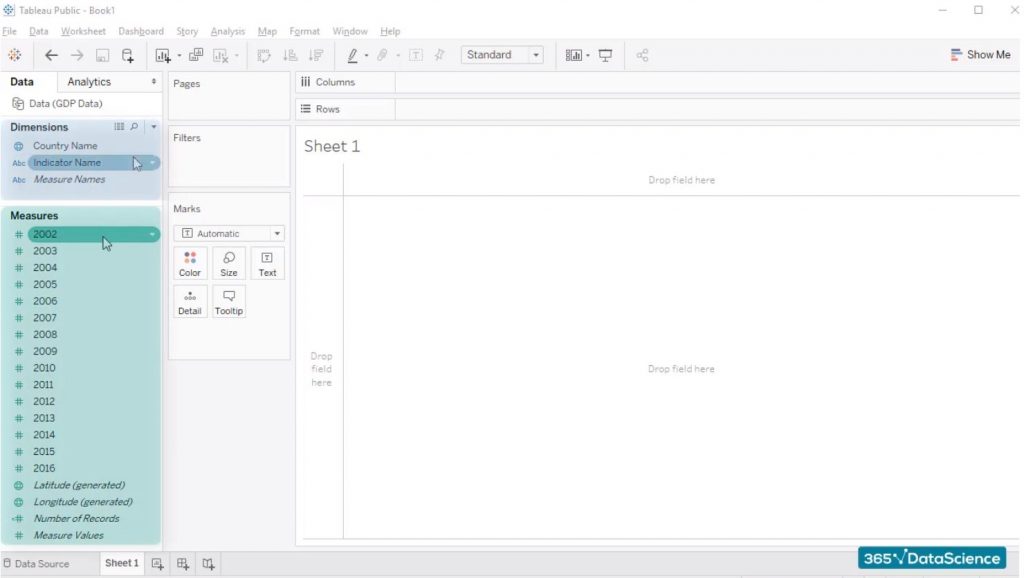
The way data is organized here is rather interesting. Our attention should be focused on the ‘dimensions and measures’ part of the screen.


First off, Tableau is very smart and has managed to organize our data – categorical variables are right here under “dimensions”, while numerical data, such as the countries’ actual GDP, is under “measures”. “Dimensions” are colored in blue, and “measures” are in green.


tableau-dimensions and measures


Important Note


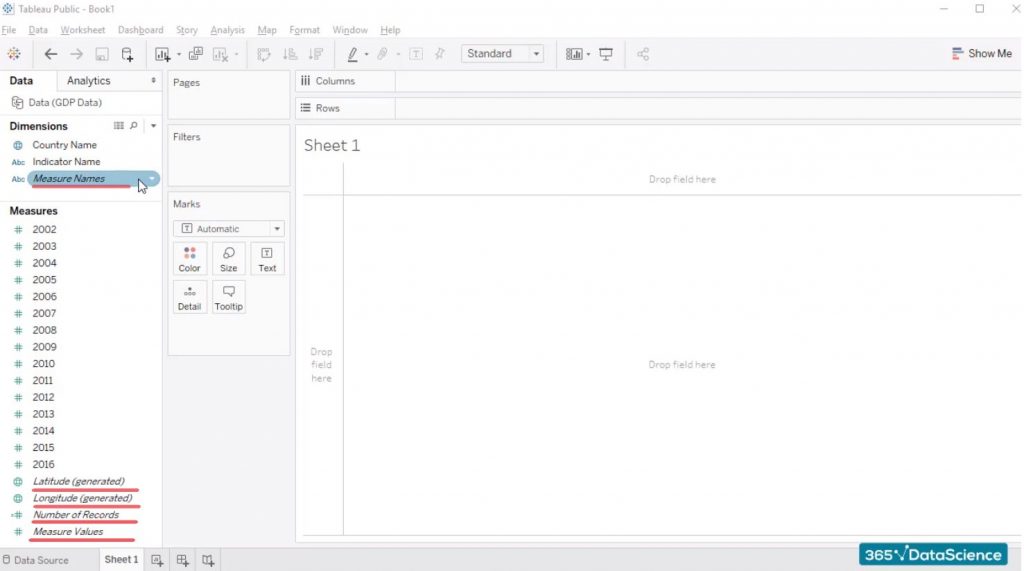
Some of the fields are in italics and others aren’t. The distinction between the two is that Tableau generates certain fields based on the data it finds. When Tableau generates its own fields such as the “Measure names” field, these are fields that are not contained in our original data source, but Tableau deems that these can be useful and creates them for us. The same thing is true for “Latitude”, “Longitude”, “Number of records”, and “Measure values” we see in green under “Measures”. The rest of the fields written without Italics are the ones we saw in the Excel file we loaded – “Country name”, “Indicator name”, and the years from 2002 to 2016, where we have countries’ GDP figures.


tableau-new-created-italic


Important detail 


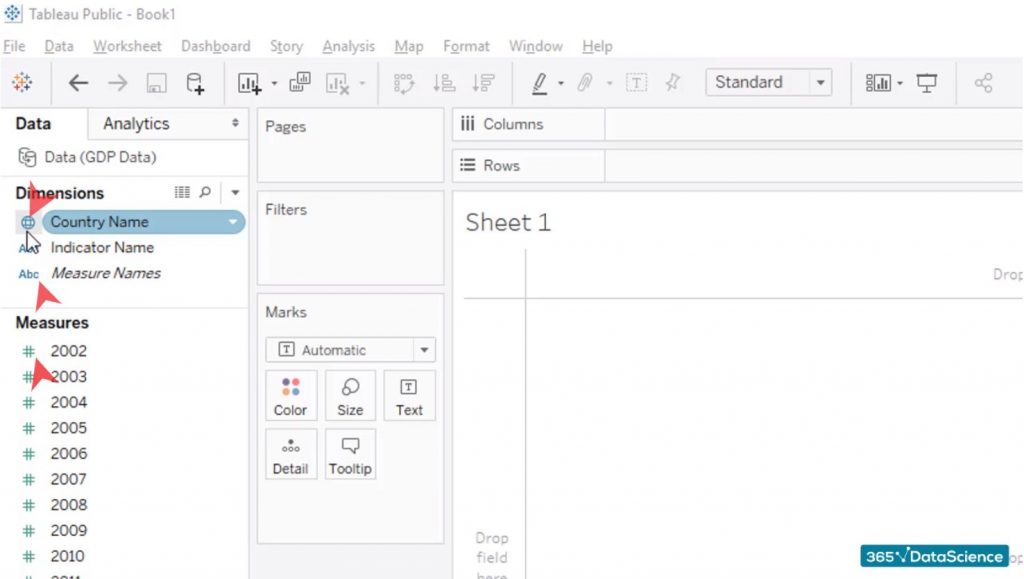
Tableau adds an icon right next to each of the fields we have under “Dimensions” and “Measures”. This is what allows us to understand how Tableau reads the data. The first field under “Dimensions” is “Country name” and its icon is the globe. Tableau recognizes that this field is related to actual countries, and it is ready to help us out when we need to visualize such data. If we click on the icon, we’ll be able to see that this is a string and that its geographic role is of Country/Region, as it should be.


At the same time, the tiny “Abc” icon of the “Indicator name” field shows us that this is a text value. And in fact, when we click on it, we can see that this is a string. However, in contrast to what we have for the “Country name” field, the geographic role of “Indicator name” is “None”. That’s because this is purely a text value.


tableau-different types


What about the year measures we have below?


Well, these are numerical values, right? Therefore, it comes as no surprise that when we click on their icon (designating numerical values), we will see these are numbers.


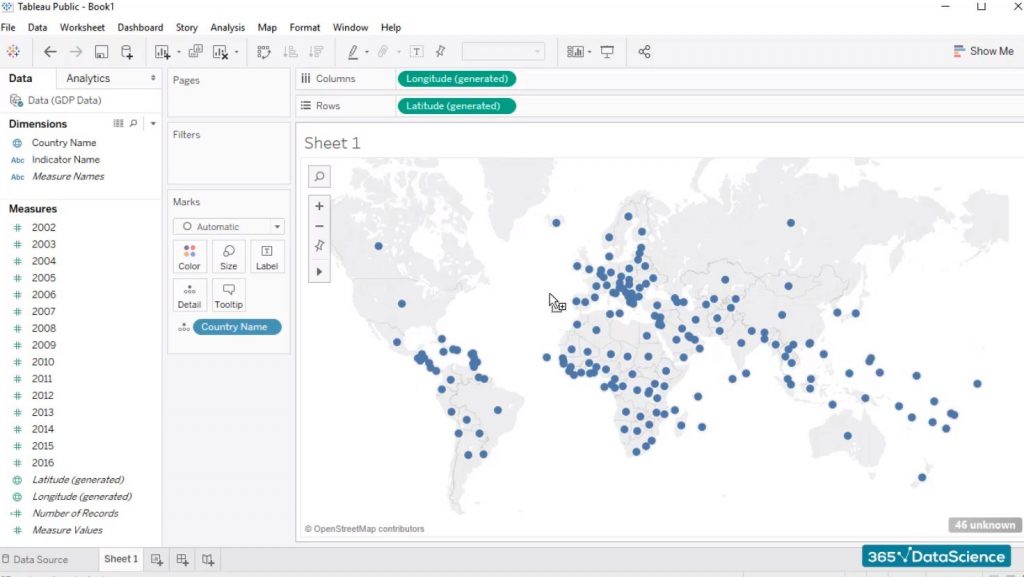
Let’s drag the “Country name” field into the workspace area. And…There it is!


tableau-gdp-world map


Tableau created a world map that shows us the location of each of the countries we have in our data source.


It is quite interesting to see that the field we see under Columns and Rows isn’t country name but are artificially generated Longitude and Latitude fields. At first, it may seem strange, but then when you think about it, it is intuitive. Tableau understands “Country name” is a geographical field. This is why it will do much more than simply create a row or a column containing a list of the countries we have in the Excel file.


No, the program is smarter than that. It reads the countries names and then creates the two fields “Longitude” and “Latitude” in order to map each country geographically. And hence the beautiful map we have here.


GDP per year


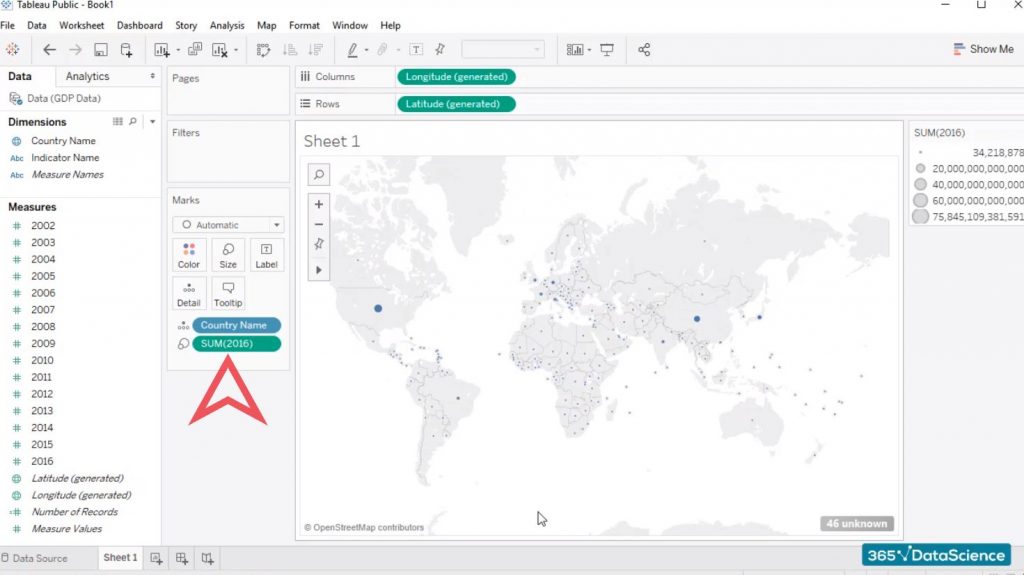
Now, let’s drag the year 2016 into the map.


tableau-SUM-gdp-2016


We can see that Tableau updates the chart, adding the 2016 GDP of each country… If we hover above each of the dots, we have a representing of the countries on our map. The US GDP for 2016 was more than 18 trillion dollars, while Canada’s GDP was around 1.5 trillion dollars.


Everything looks good. Our first chart in Tableau is almost ready.


One finishing touch to fully create a chart in Tableau


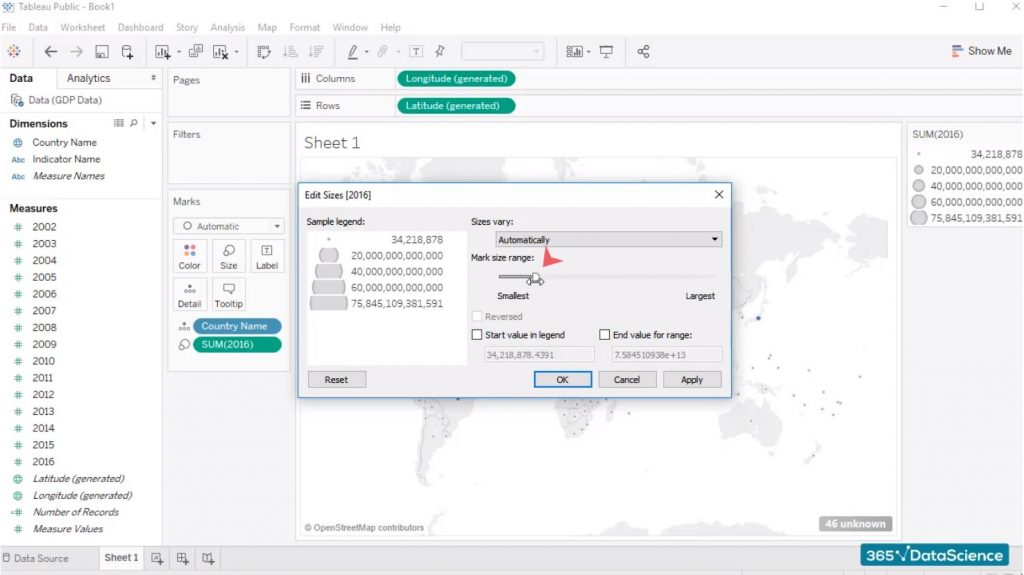
You can enlarge the bubbles indicating the size of a country’s GDP a bit. To do that, you can work with the newly appeared SUM(2016) pane on the right side of the screen. Just click on its tiny arrow and select “Edit Sizes”. The ‘edit sizes’ dialog box allows you to enlarge the bubbles you see in the visualization.


If you click “Apply”, you’ll see the bubbles in the visualization increased. This makes it a bit easier to compare the GDP of different countries.


tqableau-bubble-Size


The final touch will be to edit the name of this visualization. Double click on “Sheet 1” and simply type a title. Anything is better than “Sheet 1”. For example, you can simply type “GDP per country comparison”. And here we are.


That’s how you create a chart in Tableau


And that’s just the beginning!


To sum up, Tableau’s goal is to help users present their data by offering a huge variety of data visualization tools to choose from. Now you know how to create your first Tableau chart just by dragging and dropping the relevant objects. In our next tutorial, we will learn how we can duplicate sheets in Tableau.


Stay tuned for more Tableau tutorials and insights of the Data Scientist’s life!


data science training


#Tableau
#365datascience #DataScience #data #science #365datascience #BigData #tutorial #infographic #career #salary #education #howto #scientist #engineer #course #engineer #MachineLearning #machine #learning #certificate #udemy

https://jooble.org/

https://365datascience.com/https-jooble-org/ -

#365datascience #DataScience #data #science #365datascience #BigData #tutorial #infographic #career #salary #education #howto #scientist #engineer #course #engineer #MachineLearning #machine #learning #certificate #udemy

Answer for Warning message

https://365datascience.com/dwqa-answer/answer-for-warning-message/ -

Hi Luigi,

This is simply a warning (a way for developers to communicate with us – users).

Note that ‘deprecated’ means that it is still functional, but they will be removing it in the future. Sometimes they never remove such functions, they just stop supporting them (and stop using them in newer code).

Python is an open-source project and all libraries are being updated all the time by different people. In this case one method case been replaced with another. The summary table you are creating is using this method… for now. In the next version that will surely change.

Usually everyday users are never affected by such changes, but this is very important for Python developers, writing the libraries.

Best,
The 365 Team


#365datascience #DataScience #data #science #365datascience #BigData #tutorial #infographic #career #salary #education #howto #scientist #engineer #course #engineer #MachineLearning #machine #learning #certificate #udemy

Best Degrees to Become a Data Scientist (2020)

https://365datascience.com/best-degrees-data-scientist/ -

best degrees to become a data scientist, best degrees to get hired as a data scientist in 2020


Best Degrees to Become a Data Scientist


Today, to get into Data Science, you need a degree that signals potential employers you are the qualified candidate they’re looking for.


We, at 365 Data Science, have conducted several studies on this topic to define the best degrees to become a Data Scientist.


So, in this post, we’ll go over levels, disciplines and university ranks. These will help you decide what degree is worth pursuing… Or if your current degree is suitable for the field.


But before we get down to the results, we want to quickly disclose the methodology behind our approach.


For the third year in a row, we’ve used LinkedIn to gather background information of current data scientists. We’ve used their education and prior experience to identify the required credentials for the field. We’ve also collected data from job-search websites to determine the most important qualifications and skills employers are searching for in a data scientist.


Let’s start with the level of education.


Do You Need a Graduate Degree to Become a Data Scientist?


Our results show that virtually all data scientists have graduated from an institution of higher education. This includes Bachelors, Masters, MBAs, and Ph.Ds. However, some degrees seem to be much more popular than others.


In fact, only around 3% of all data scientists in our sample owned an MBA.


That’s not entirely surprising. If you decide to do an MBA, chances are you’re not aiming at the hands-on technical data scientist role on the team.


Bachelors, Masters, and Ph.Ds round up roughly 91% of the data, with 79% being split among Masters and PhDs.


This means that roughly 4 out of every 5 data scientists have at least a master’s degree.


So, yes, going for a graduate program is highly recommended.


Of course, if you think a B.A. is as high as you want to go, there is no need to be discouraged.


Nearly 12% of the data scientists worldwide had only completed an undergraduate prior to entering the field. But in some countries, like India, the number goes up to 31%.


This refreshing indicator shows employers are starting to value skills over years of schooling. So, a qualified candidate today has a higher chance of breaking into the field, compared to two years ago.


And if we take a quick look at the job adverts available online, we’ll see that most of them list B.A. or M.S. degrees as the desired educational level.


So, it’s safe to say that a Ph.D. is not a requirement for the job, but a bonus.


Well, that’s partly because most PhDs have a lifelong interest in doing research. So, they’re harder to lure away with high-paying job ads.


Can I Become a Data Scientist with No Experience?


Another factor is the amount of time a candidate has spent in data science or a related field. On average, employers expect about 3.5 years of experience in the field for an undergraduate, compared to only 2.5 for somebody with a graduate degree.


Therefore, having an M.S. compared to a B.A. roughly equates to a year’s difference in the field. Of course, this comes as a result of the proficiency graduate students are expected to have, compared to undergraduates.


All things considered, it’s quicker to break into Data Science if you’ve got a Master’s degree.


That’s probably the safer route to success. However, it must be noted that it’s also the more expensive approach.


That said, what you want to do after graduation plays a big role as well.


For example, if you plan on breaking into Consulting, you’ll definitely need a graduate degree. But if you want to succeed in data-driven recruitment, a B.A. will work just fine.


Different job roles and activities require different degrees. So, you should take this into account when making a choice.


What Are the Best Degrees to Become a Data Scientist?


A major, a concentration or a discipline – no matter how you call it, each degree has a field of expertise.


Our research suggests that 89% of data scientists come from a quantitative background.


Whether it’s the B. A., or the M. S., usually at least one of the degrees is quantitative.


Of course, natural sciences and math-heavy social studies degrees are considered quantitative as well. The first require conducting experiments and extracting insights, and the second help students develop an analytical way of thinking.


But there’s been one definitive trend for the last 3 years. When it comes to best degrees to become a data scientist:


With 18.3%, Computer Science is the most well-represented degree among data scientists.


This isn’t a complete shock, since good programming skills are essential for a successful career in the field.


It’s not all that surprising that a degree in Statistics or Maths is among the top of the list (16.3%). After all, the ability to correctly interpret results is a huge part of Data Science. However, this percentage marks a decrease from previous years. This decline mainly comes from the ongoing rebranding of the discipline.


What was once known as Statistics is being intertwined with other majors and presented as Business Statistics, Econometrics…Or even Machine Learning.


This way, Statistics’ share of the pie is slowly split among the other fields that benefit from this name change.


With a decrease in the stats representation comes an increase in another group – economics and social sciences (12.3%). This may seem rather odd at first, but this is the second most-represented degree choice among data scientists.


Why?


Because people with such degrees can both analyse the data properly and build a story around the insights they find. Yep, simply stating a change in X results in a change in Y is often not good enough. We also need to construct sets of rules to take advantage of this knowledge.


There’s another reason for the influx of economics majors. Many of them start off as analysts and gain experience in the field as they go.


Overall, the analyst role has become a catalyst for many social studies graduates who want to transition into data science.


In addition, a lot of the work in data science is related to optimizing financial decisions and policies. So a business or financial mindset is always welcome.


Is a Data Science Degree the Best Degree to Become a Data Scientist?


Data science as a degree itself is not really that hot. 21% of current data scientists own a concentration in the field. And, although the percentage is higher compared to 2019 (12%), Data Science is still very new as a discipline. That’s why it isn’t widely offered in universities across the globe yet.


The limited availability leads many students to pick one of the other related options, like computer science or statistics.


So, the most obvious choice, isn’t particularly the correct one, when it comes to picking a degree.


Of course, the trend might shift within the next decade. But for now, data science as a degree is still playing catch up to the more popular options.


Currently, if we have a look towards the current job market, we’ll see some slightly different trends.


Checking the most-commonly sought-after concentrations in the field, Math and Statistics are the clear leaders.


This is especially true for companies looking for graduate-level employees. In those cases, roughly 86% of all Data Science ads listed Mathematics, Statistics, or both among their desired concentrations.


The shift in the trend comes from consulting companies not looking for Computer Science majors.


Less than 30% of consulting companies listed Computer Science as the desired concentration for potential candidates.


Once again, that can be attributed to the preference for great storytellers, high demand for understanding data analytics and economics… And maybe a bit of a prejudice against CS graduates.


In general, computer science is the leader among current data scientists. However, stats and mathematics are what employers are looking for at the moment. Of course, this also has something to do with the emergence of high-level languages such as Python and R.


Either way, different aspects of data science search candidates from specific fields. Therefore, knowing which domain of data science you want to make a career is crucial for your choice of discipline. And vice versa – if you have already graduated in a certain field, your transfer into data science may be already predetermined.


University rankings vs Best Degrees to Become a Data Scientist – Which is more important?


Even though your major is essential, so is the reputation of the institution you got it from.


Our research showed that roughly 31% of current data scientists hold a degree from one of the top 50 universities listed by Forbes magazine.


This essentially states that roughly 1 in every 3 data scientists graduated from one of these 50 institutions.


In comparison, 9%, or 1 in every 11, graduated from a university outside the top 50, but inside the top 100 in the rankings.


Going further down the rankings, we see that 1 in 10 data scientists holds a degree from a school ranked between 101st and 200th place.


This trickling down might not sound very shocking. But consider the following.


100 universities make up 9% of the sample, whilst 50 make up 31%.


This means that you are about 6 times more likely to become a data scientist if you went to a high-ranking school.


What happens if we add these numbers together? We see that the top 200 schools are responsible for producing 50% of all data scientists in the field. So, a degree from an elite institution is a better signal to employers that you are a worthy candidate than your major.


However, don’t be quick to despair – there is a silver lining.


Around one-fourth of all data scientists in our sample have a degree from a school outside the top 1,000 or one not even present in the rankings.


That suggests that sufficient experience and skills can actually outweigh a university degree!


So, if you can’t get into an elite institution, sharpen your coding and statistics skills enough to stand out!


Best Degrees to Become a Data Scientist – In Conclusion


A graduate degree from a prestigious school is your best bet of becoming a data scientist.


However, the best major varies, depending on what you want to work afterwards.


Computer Science is the safest option, as it gives you a lot of freedom and is highly sought-after.


But if you intend to go into Consulting, Math or Statistics are a better choice. Planning to become a data analyst first? You can look for a degree in Economics, since the progression-line is much more straight-forward there.


Ready to take the next step towards a data scientist career?


Check out the complete Data Science Program today. Start with the fundamentals with our Statistics, Maths, and Excel courses. Build up step-by-step practical experience with SQL, Python, R, and Tableau… And develop in-demand skills with Machine Learning, Deep Learning in TF2, Credit Risk Modeling, Time Series Analysis, and Customer Analytics. Not sure you want to turn your interest in data science into a full-scale career? We also offer a free preview version of the Data Science Program. You’ll receive 12 hours of beginner to advanced content for free. It’s a great way to see if the program is right for you.


data science training


#Career, #DataScience, #ProTips
#365datascience #DataScience #data #science #365datascience #BigData #tutorial #infographic #career #salary #education #howto #scientist #engineer #course #engineer #MachineLearning #machine #learning #certificate #udemy

Wednesday, February 26, 2020

Answer for Unconverted data error

https://365datascience.com/dwqa-answer/answer-for-unconverted-data-error/ -

Hi Viktorija,

Could you please provide the line (lines) of code that produces this error?

Regarding the kaggle dataset – we have actually divided it into two -> data until 2014 and data after 2014, so we can test the dataset.

You can find all datasets here: https://www.dropbox.com/sh/6cc01fcljk457gd/AADD_MJFfVcE5VR3UzlKDATla?dl=0

Best,
The 365 Team


#365datascience #DataScience #data #science #365datascience #BigData #tutorial #infographic #career #salary #education #howto #scientist #engineer #course #engineer #MachineLearning #machine #learning #certificate #udemy

Tuesday, February 25, 2020

How to Become a Data Scientist in 2020 - Top Skills, Education, and Experience

https://365datascience.com/become-data-scientist-2020/ -

become data scientist in 2020, how to become a data scientist in 2020


Introduction


Data science has been one of the trendiest topics in the last couple of years. But what does it take to become a data scientist in 2020?


For the 3rd consecutive year, we have asked the data. In a nutshell, here are the latest research results that we have found:


The typical data scientist is a male, who speaks at least one foreign language and has 8.5 years of work experience behind their back. They are likely to hold a Master’s degree or higher and most definitely use Python and/or R in their daily work.


But such generalizations are rarely helpful. Not only that, they could be misleading and sometimes discouraging. That is why we have sliced and diced the data to reveal a number of different insights:


  1. Overview

  2. Previous experience

  3. Education

  4. Country and Degree

  5. Area of Studies

  6. Online courses and Degree

  7. Degree and Direct hires

  8. Years of experience

  9. Country and years of experience

  10. Coding languages

  11. Fortune 500 companies and coding language

  12. Country and coding language

Please use the list above to navigate through the article or simply read the whole piece. To give you the best perspective possible as we go through the different takeaways, we will also make comparisons to previous years’ surveys. If you first want to get acquainted with what it took to become a data scientist in 2018 and 2019, pleases follow these links:


2019 Data Scientist Profile


2018 Data Scientist Profile


How we collected and analyzed our data:


The data for this report is based on the publicly available information in the LinkedIn profiles of 1,001 professionals who are currently employed as data scientists. The sample includes junior, experts, and senior data scientists. To ensure comparability with previous years and limited bias, we collected our data according to several conditions.


Location


40% of the data comprises data scientists currently employed in the United States; 30% are data scientists in the UK; 15% are currently in India; 15% come from a collection of various other countries (‘Other’).


Company size


50% of the sample are currently employed at a Fortune 500 company; the remaining 50% work in a non-ranked company.


These quotas were introduced in light of preliminary research regarding the most popular countries for data science, as well as the employment patterns in the industry.


Alright, without further ado…


Overview


For a third year in a row, the verdict is in: there are twice as many male data scientists as there are female. This trend, while unfortunate, is not really surprising as the field of data science follows the general trend in the tech industry.


In terms of languages spoken, a data scientist usually speaks two – English and one other (often their mother tongue).


When it comes to professional experience, we find that you can’t really become a data scientist overnight.


It takes 8.5 years of overall work experience. Interestingly, this is an increase of half a year compared to the data in 2019. Another interesting observation is that data scientists have held their prestigious title for an average of 3.5 years. Last year, that metric stood at 2.3 years. While our study is not based on panel data, we can make the claim that once you become a data scientist, you are likely to stay one.


Regarding programming languages, in 2018, 50% of data scientists were using Python or R.


This number increased to 73% in 2019 to completely break all records this year. In 2020, 90% of data scientists use Python or R. And no, you are not the only one who finds it amazing. Such a high adoption rate in such a short time period is an absolutely stunning feat for any tool in any industry ever.


Finally, your level of education will most definitely make a difference when trying to become a data scientist. About 80% of the cohort holds at least a Master degree, which is a 6 percentage point increase from last year.


Previous experience


Each year, we look at the previous work experience of a data scientist. This part of the results proved to be the most useful for aspiring professionals, figuring out the common career paths to becoming a data scientist.


To reiterate, in 2020, data scientists had 3.5 years with the title and 8.5 years in the workforce on average.


But… what did the data scientist do before becoming a data scientist?


According to our sample, they… were already a data scientist! Or at least half of the cohort (52.4%). If we compare this value with previous years, there were 35.6% such cases in 2018 and 42% in 2019. So, year after year, the position becomes more and more exclusive – an observation we could infer from their average work experience.


This insight suggests that there aren’t too many career options after being a data scientist.


In other words – once a data scientist, always a data scientist. At least that’s the situation in 2020.


Regarding other relevant career paths, starting out as a data analyst is still the preferable path (11% overall), followed by academia (8.2%) and… data science intern (7.0%). This breakdown is one of the most consistent segments of our yearly research since 2018. Hence, you can bet your data scientist career on it.


Education


Education is one of the 3 major sections of most resumes and that’s not likely to change. Educational background serves as a signal to your future employers, especially when you don’t have too much experience. So, what education gives the best signal if you want to become a data scientist?


education of the data scientist


According to our data, the typical data scientist in 2020 holds either a Master degree (56%), a Bachelor (13%), or a PhD (27%) as their highest academic qualification.


These statistics might not seem counter intuitive at first. However, there is actually a considerable drop in “Bachelor degree only” data scientists compared to 2019 (19%) and 2018 (15%). Data science requires an advanced level of expertise. And that’s typically acquired through graduate or postgraduate forms of traditional education, or through independent specialized study ().


But while specialization is important, too much specialization, such as a PhD is not a prerequisite to breaking into data science. In fact, the percentage of PhD-holders has been unremarkably consistent over the years, constituting approximately 27% of our sample.


The Master’s degree, however, is solidifying its position as the golden standard of academic achievement necessary to become a data scientist in 2020.


We are observing a 10% increase in the professionals who hold a Master degree compared to the 2019 cohort (46% in 2019 vs 56% in 2020).


A Master’s degree is a great way for a Bachelor to specialize in a given field.


Generally, there are two types of Master’s degree choices – increasing your depth (dig deeper into a topic) or increasing your breadth (change your focus to diversify your skillset). One assumption is that people with Economics, Computer Science or other quant Bachelor’s degree have pursued a trendy data science Master’s. This is further corroborated in our section on fields of study.


Arguably, there is another factor at play here as well, and this is the increased popularity of the field.


Industry reports like Glassdoor’s 50 Best Jobs consistently named Data Science the winner in 2016, 2017, 2018, and 2019.


Google searches for data science have at least quadrupled over the last five years as well. This certainly plays to the increased interest in data science as a career, and as a result, to a more selective hiring process in certain regions (see Country and years of experience below).


Finally, although data science is becoming a more competitive field, more than 10% of data scientists successfully penetrate the field with only a Bachelor degree (13%). It’s true the number is lower than what we’ve observed in the last two years (19% in 2019 and 15% in 2018). Nevertheless, data science remains accessible to Bachelor holders. In fact, if we look at country-specific data, a more nuanced picture emerges.


Country and Degree


As we stated in the Methodology section in the beginning of this article, we gathered our data according to location quotas; data scientists in the USA comprise 40% of our data, data scientists in the UK contribute to 30% of our observations; and India and the rest of the world each comprise 15% of the 2020 cohort.


That said, the increase in data scientists holding a Master’s degree is widely observed in both the UK and the States (54% and 58%, respectively, compared to 44% in 2019).


In India, the number of data scientists holding a Master’s has also grown by 8% in 2020, compared to previous years (57% in 2020 vs 49% in 2019 and 2018).


Interestingly, this doesn’t correspond to a comparable decrease in data scientists who have an undergraduate degree in India (32% in 2020, compared to 34% in 2019), which is still the highest percentage of Bachelor-holders across our cohort. Both PhD graduates and professionals holding degrees from our “Other” cluster are also seen less frequently in the current research than they were in previous years. As we mentioned above, it is plausible that a specialization with a “trendy” data science Master’s is becoming the preferred career path of many people in the field.


It’s also worth noting that you don’t need a PhD to become a data scientist in India.


In fact, postgraduates with a PhD make up only 3% of our data scientist sample in India; this is both 30% less than the US data, and the least represented cohort in India.


So, these data corroborate two tentative conclusions. Academically, a Master’s degree is establishing itself as the most popular degree for becoming a data scientist across the globe. And, if you are holding only a Bachelor’s degree, India provides the best career opportunities for starting a career in data science.


Area of studies


What is the best degree to become a data scientist? If you have followed the industry (or at least our research) over the past years, you would be inclined to respond with ‘Computer Science’ or ‘Statistics and Mathematics’. After all, data science is the lovechild of all these disciplines. But you would be mistaken.


In 2020, the best degree to become a data scientist is… Data Science and Analysis!


At long last – ‘Data Science and Analysis’ graduates have made their way to the top of our research!


Before we continue with this analysis, a note on methodology. Because there is a massive number of uniquely nuanced – and correspondingly named – degrees in the academic world, we grouped our data into seven clusters of areas of academic study:


  • Computer science, which does not include machine learning;

  • Data science and analysis, which includes machine learning;

  • Statistics and mathematics, which includes statistics and mathematics-centered degrees;

  • Engineering;

  • Natural sciences, which includes physics, chemistry, and biology;

  • Economics and social sciences, which includes studies pertaining to economics, finance, business, politics, psychology, philosophy, history, and marketing and management;

  • Other, which includes all other degrees the data scientists in our sample pursued.

So, Data science and analysis is finally the degree that’s most likely to get you into data science. Awesome!


Compared to both 2019 (12%) and 2018 (13%), we’re seeing a significant increase in the professionals who’ve graduated with a data science specialized degree in 2020 (21%). Given our previous observations (see Education above), it doesn’t come as a surprise that the majority of these degrees are at Master’s level (85% of the Data science and analysis cluster). Therefore, it seems like data science is a preferred specialization for any quant Bachelor.


This finding suggests traditional universities are beginning to respond to the demand for data scientists. And, in line with that, offer curriculums that develop the data scientist skillset. Another marked trend is that the Data Science and Analysis degree is becoming the affirmed gateway degree into data science, especially if you’ve previously graduated from a different field.


Consider, for example, the top 3 degrees obtained by data scientists in 2019 and 2020:


2019


  • Computer Science (22%)

  • Economics and social sciences (21%)

  • Statistics and Mathematics (16%)

2020


  • Data Science and analysis (21%)

  • Computer Science (18%)

  • Statistics and Mathematics (16%)

Data Science and Analysis has obviously taken the lead from Computer Science.


What’s more, its appearance has completely removed Economics and social sciences from the top 3 ranking, even though this specialization was a close second in 2019.


Graduates form the Engineering, Natural Sciences, and Other fields constitute approximately 11% of our data each. And, we can say this hasn’t changed much compared to previous years.


Interestingly, most women in our sample most likely earned a Statistics and Mathematics related degree (24% of the female cohort).


In comparison, men most likely earned a degree in Data Science and Analysis (22%), with Computer Science (19%) being a close second.


In general, data science is considerably well-balanced in terms of best degrees to enter the field.


You can become a data scientist if you have a quant or programming background… Or if you further specialize in Data Science and Analysis. And the way to do that is either through a traditional Master’s degree or by completing a bootcamp training or specialized online training programs.


 Online courses and Degree


With data scientists coming from so many different backgrounds, we may wonder if their college degrees have proved sufficient for their work.


Even with no research, the answer is – no way. No single degree can prepare a person for a real job in data science.


Actually, data scientists are closer to ‘nerds’ than to ‘rock stars’ – it’s less about talent and more about hard work. Therefore, you can bet that they take their time to self-prepare. In our research, we have used the closest LinkedIn proxy available – certificates from online courses. Our data suggest that 41% of the data scientists have included an online course, which is practically the same as the past two years (40% in 2018 and 43% in 2019).


Note that not all people post all their certificates, so these results are actually understatements.


Degree and Direct hires


Can you become a data scientist right after graduation? While not unheard of, the data suggest that it is unlikely. Less than 1% of our cohort succeeded in becoming a data scientist without previous experience. And they either had a PhD or a Master’s (80% of these men, and 100% of the women). A quarter of these direct hires also reported having received an online certification.


Something we found interesting is that the direct hires in our cohort almost completely mirror the profile of the typical data scientist in 2020 (see above).


That said, let’s discuss what kind of experience you need to become a data scientist, if you’re not in that lucky 1%.


Years of experience


The typical data scientists in 2020 has been working as a data scientist for at least a year already (70% of our cohort), with the highest number of data scientists being in their 3-5 years bracket (28%) followed by data scientists in the 2-3 years bracket (24%), and in their second year on the job (19%).


Data Scientists in their first year on the job constituted 13% of our 2020 data.


These are all interesting statistics, especially when considered in relation to 2019 and 2018 data. More specifically, we’re observing a significant decrease in the number of data scientists who are just starting out their careers in 2020 (13%), compared to data scientists starting out in 2019 (25%) and 2018 (25%). Given the increase in average experience as a data scientist, we can conclude that these professionals stay within the field, making it harder for junior people to enter.


The second interesting trend here is the increase in number of data scientists who are in their 3-5 and 2-3 years on the job, compared to the past two years.


In 2018, 25% of data scientists had more than 3 years of experience, whereas in 2020, this number is reaching 44%. This indicates that data science experts and senior data scientists are staying in the field, rather than moving to some other industry.


Nonetheless, we mentioned that there are some important cross-country differences that invite further exploration. So, let’s consider these in more detail in the next section!


Country and years of experience


A cross-country analysis of the on-the-job experience of the data scientist reveals a curious trend.


In terms of seniority, the data scientists in the US cohort were certainly the most experienced in our data.


More than 50% of the cohort were at least on their third year working as data scientists, with 20% on the job for more than 5 years. Тhe US is the least friendly environment for career starters in data science. Only 8% of our US cohort was in their first year as data scientists, and 15% – in their second.


According to our data, the data science field in the UK is easier to penetrate. 11% of the UK sample were starting out their career as data scientists, whereas 20% were already in their second year on the job.  Nonetheless, the largest represented group in the cohort were professionals in their third or fourth years on the job (29%).


If you’re looking for the country that offers the most opportunities to career starters, the data suggests that this is India. More than 50% of our sample consisted of data scientists within their first or second year on the job. This is great news for someone who is just getting started with data science and wants to nurture their expertise into a career.


Of course, this data doesn’t come as a surprise, with some of the world’s largest companies opening offices in Bangalore and Hyderabad, including Amazon, Walmart, Oracle, IBM, and P&G.


The rest of the world, or our “Other” country cluster shows a more balanced distribution of data science professionals regarding years of experience. A little less than 20% of the cohort is in their first or second year as data scientists, a little over 20% are in their third or fourth, and a quarter were in the 3-5 years bracket. That said, it bears repeating that the largest players in our “Other” country cluster were Switzerland, the Netherlands, and Germany. Therefore, we can tentatively say that data science is becoming a more prominent field in Western Europe, and since the field is not yet flooded with data science talent, both junior and mid- to senior professionals are in demand.


Programming skills of data scientists


When looking for programming languages proficiency, we had to turn to the LinkedIn skills ‘currency’ – endorsements. While an imperfect source of information, they are a good proxy of what a person is good at. I would not be endorsed by my colleagues for Power BI, if I were mainly training ML algorithms, would I?


With this clarification out of the way, let’s dig into the data. Python dethroned R a year or so ago, so we won’t comment too much on this rivalry. Moreover, knowing that 90% of the data scientists use either Python, or R, we could completely close the topic here and move on.


But that would be a bit ignorant, especially towards SQL!


74% of the cohort “speaks” Python, 56% – R, and 51% SQL. We are recording a 40% increase from last year (36%). There are various factors that could contribute to this number. One possible explanation is that companies don’t always understand the data scientist position well. This leads them to hire data scientists and overload them with data engineering tasks. For instance, the implementation of GDPR and the massive reorganization of data sources in data warehouses placed some data scientists in the unfavorable position to lead or consult on such projects. Inevitably, SQL had to be added to their toolbelt for the sake of ‘getting the job done’. This phenomenon is getting more and more attention not only in the context of SQL, but also Big data structures related to database management. As a result, data scientists have acquired new skills at the expense of writing fewer machine learning algorithms.


Another important point in favor of SQL is that BI tools such as Tableau and Power BI are heavily dependent on it, thus increasing its adoption.


And that’s why SQL is going further up, even catching up with R. The programming languages picture is completed by MATLAB (20.9%), Java (16.5%), C/C++ (15.0%), and SAS (10.8%). Once again, LaTeX (8.3%) is also in the top 10.


Why?


Well, academia does not harm your chances to become a data scientist as we see from the background of our cohort.


F500 and coding language


We can’t stress enough how important are Python and R for the data science field in 2020. However, their strengths are their flaws, when it comes to big companies. Python and R are both open source frameworks that can be buggy or not well documented, unlike well-established languages such as MATLAB or C.


And the data does indeed confirm this claim. Take Python for one – 70% of F500 data scientists employ Python against 77% of non-F500 data scientists. This sounds like unpleasant news, but in fact, it isn’t. Both Python and R have been closing the gap over the years. It seems like F500 companies are rethinking their organizations and are much more inclusive of the new technologies as compared to the data in 2018.


Apart from the different rate of employment of Python, the rest of the breakdown by coding languages remains uninterestingly consistent.


Country and coding language


In the past, your country of employment would dictate many of your life decisions – what language to learn, what rules to abide by, and what customs to respect or adopt. But does this apply to coding languages?


Since 2018 we look into USA, UK, India and ‘Rest of the world’. Our findings used to show that R was ‘winning the people’ over Python in USA and India. On the other hand, UK and ‘Rest of the world’ were already slowly phasing out R in favor of Python.


Well, USA and India are no longer ‘lagging behind’ when it comes to Python adoption. In other words, Python is now king in all countries. Hence, your best bet at becoming a data scientist is to bend the knee and join the Pythonistas in their search for data driven truth.


For the record, the breakdown by coding language is consistent across countries with R and Java taking the biggest hit from the Python supremacy in 2020. SQL remains unaffected and even gains a bit of traction as compared to previous years.


Conclusion


For a third consecutive year, the 365 Data Science research into 1,001 current data scientists LinkedIn profiles reveals e. And what a year it is!


This research reveals that the field is ever evolving and adapting both to the needs of businesses as well as its growing popularity in academia and around. Universities are catching up with the demand while Master’s is establishing itself as the golden standard degree.


Python continues to eat away at R, but SQL is on the rise, too!


India has earned the spot of best country for starting a career as a data scientist by demonstrating higher demand for junior data scientists than the US and the UK. It is also the place to be if you only have a Bachelor degree.


Of course, we are tremendously interested in how these trends will develop in the following 2-5 years, but in the meantime, let us know if you think we’ve missed anything of interest! We are on a mission to create an informative and ultimately helpful account of the data scientist job and how it changes with time. After all, making the best career decision for yourself means being informed!


So, stay curious, grow your programming skillset, and good luck in your data science career!


Links to other studies:


2019 Data Scientist Profile


2018 Data Scientist Profile


#Career, #DataScience
#365datascience #DataScience #data #science #365datascience #BigData #tutorial #infographic #career #salary #education #howto #scientist #engineer #course #engineer #MachineLearning #machine #learning #certificate #udemy
Monday, February 24, 2020

How to Install TensorFlow 2 in Anaconda

https://365datascience.com/install-tensorflow-2-anaconda/ -

install TensorFlow 2 in Anaconda, how to install TensorFlow 2 in Anaconda, tensorflow, tensorflow 2, anaconda


How to install TensorFlow 2 in Anaconda?


TensorFlow has been a very hot framework in the past few years. With its latest version out, you must be wondering how you can install TensorFlow 2 on your machine and get it running.


In this tutorial, we’ll show you how to create a new environment, install TensorFlow, upgrade to its latest version and then add a new kernel to Jupyter.


Why Anaconda to Install TensorFlow 2?


The good thing about Anaconda is that NumPy and pandas, along with many other libraries, come automatically with it. That’s a strong plus because there’s no need to install the main packages separately as with some other software for programming in Python.


If you don’t have Anaconda installed, you can refer to our tutorial on installing the Anaconda package.


How to check our current environments?


First, please open Anaconda Prompt. Most probably, the easiest way to reach it is by searching for it in your Start menu.


Type ‘conda info –envs’ like this and you will get a list of all the environments you have created before:


python3, TF2, tensorflow2, conda info --envs, install tensorflow 2


As you can see, we have 4 different environments – the base one, Python 2, Python 3, and Python 3.7 with TF2 installed on it. If you have never created an environment before, you should only have the base environment.


But that should not concern you – after all, that’s why we are here.


How to create a new environment in Anaconda?


We have to write: “conda create –name”. Then we must include the name of the environment we want to create.


conda create --name py3-TF2.0, python 3, TF2, TensorFlow2, install tensorflow 2


You can use Anaconda not only for Python but also for other programming languages. So, it’s always advisable to include ‘Python’ or simply ‘Py’ in the name. Once you’ve done that, you can add the version of Python. In our case, that would be Python 3.


A good idea is to add any other clarification you see fit when you have more than one environment with Python 3 installed. We’ll add: ‘TF2.0’ so that we know that TensorFlow 2 is installed there. Now, all of our widely used packages, including TensorFlow 1, are in the ‘python3’ environment. However, we’ll be using this ‘py3-TF2.0’ environment only when we need TensorFlow 2, so we will include that in the name.


Finally, we must finish the line with the language we want installed and its version, so: ‘python=3’.


conda create --name py3-TF2.0 python=3, python 3, TF2, TensorFlow2, install tensorflow


We get the package specifications and all that’s about to be installed.


Our new environment has been created!


Note that this process may take a couple of minutes.


How do we activate an environment?


Time to enter or activate the environment, so we can manage it. So, we should write:


‘conda activate’ and the name of the environment. So, in our case, ‘conda activate py3-TF2.0’.


conda activare, python 3, TF2, TensorFlow2, tensorflow


At the beginning of the line, we see an indication that we are in fact in the new environment. Note that it is completely empty – the only packages it contains are the default ones that come with Anaconda. Everything you’ve installed before won’t be included.


And now we are ready to install TensorFlow.


We can simply type:


python 3 TF2 install tensorflow, py3, TF2


Now, to ensure there we’ve got the latest version of TensorFlow installed, we highly recommend that you also upgrade the currently installed TensorFlow version. The proper command is:


pip install –upgrade tensorflow


Finally, we must make sure we see the kernel in Jupyter once we start it. There are different ways to go about that but the easiest one is to go back to your base environment and install two packages: “nb_conda_kernels” and “ipykernel”.


To go back to the base environment we must deactivate the current environment by writing: ‘conda deactivate py3-TF2.0’


Now you will be in the base environment.


To install ‘ipykernel’, please write: ‘pip install ipykernel’


Then to install ‘nb_conda_kernels’, please write: ‘conda install nb_conda_kernels’


These two lines should be sufficient for you to see your newly installed kernel in Jupyter.


To make sure everything is working, open Jupyter, select ‘Kernel -> Change kernel’ from the ribbon and choose our preferred kernel.


change kernel python 3, python 3, TF2, TensorFlow2, tensorflow


We prefer the newly created kernel: Py3-TF2.0. Once you choose it you will be all set!


And there you have it. Enjoy deep learning in TensorFlow 2!


Ready to take the next step towards a career in data science?


Check out the complete Data Science Program today. Start with the fundamentals with our Statistics, Maths, and Excel courses. Build up step-by-step practical experience with SQL, Python, R, and Tableau… And develop in-demand competencies with Machine Learning, Deep Learning in TensorFlow 2, Credit Risk Modeling, Time Series Analysis, and Customer Analytics in Python. If you still aren’t sure you want to turn your interest in data science into a full-scale career, we also offer a free preview version of the Data Science Program. You’ll receive 12 hours of beginner to advanced content for free. It’s a great way to see if the program is right for you.


data science training


#Python
#365datascience #DataScience #data #science #365datascience #BigData #tutorial #infographic #career #salary #education #howto #scientist #engineer #course #engineer #MachineLearning #machine #learning #certificate #udemy
Answer for unable to open CSV file in tableau

https://365datascience.com/dwqa-answer/answer-for-unable-to-open-csv-file-in-tableau-2/ -

Hi Kane!

Thanks for reaching out!

Can you please provide more information so that we can try to provide specific assistance?

Can you please tell us what is your operating system? Also, do you obtain an error message, or is Tableau unable to detect a *.csv file? A more detailed explanation supported by a screenshot may facilitate our understanding of the issue a lot.

Thank you.

Looking forward to your answer.
Best,
Martin


#365datascience #DataScience #data #science #365datascience #BigData #tutorial #infographic #career #salary #education #howto #scientist #engineer #course #engineer #MachineLearning #machine #learning #certificate #udemy
Answer for unable to open CSV file in tableau

https://365datascience.com/dwqa-answer/answer-for-unable-to-open-csv-file-in-tableau/ -

Hi Kane!

Thanks for reaching out!

Can you please provide more information so that we can try to provide specific assistance?

Can you please tell us what is your operating system? Also, do you obtain an error message, or is Tableau unable to detect a *.csv file? A more detailed explanation supported by a screenshot may facilitate our understanding of the issue a lot.

Thank you.

Looking forward to your answer.
Best,
Martin


#365datascience #DataScience #data #science #365datascience #BigData #tutorial #infographic #career #salary #education #howto #scientist #engineer #course #engineer #MachineLearning #machine #learning #certificate #udemy
Friday, February 21, 2020

Answer for why do we need group by command at the end of this query??

https://365datascience.com/dwqa-answer/answer-for-why-do-we-need-group-by-command-at-the-end-of-this-query-2/ -

Hi Kane!

Thanks for reaching out!

In this query, the GROUP BY clause allows us to obtain output per employee number. In other words, if we don’t include it, then MySQL will only display an output for the first employee number as obtained by the SQL optimiser and will disregard the rest. That’s how MySQL will behave by default.

Be adding a GROUP BY clause, we designate that we want the output to be separated by employee number.

Hope this helps.
Best,
Martin


#365datascience #DataScience #data #science #365datascience #BigData #tutorial #infographic #career #salary #education #howto #scientist #engineer #course #engineer #MachineLearning #machine #learning #certificate #udemy
Answer for why do we need group by command at the end of this query??

https://365datascience.com/dwqa-answer/answer-for-why-do-we-need-group-by-command-at-the-end-of-this-query/ -

Hi Kane!

Thanks for reaching out!

In this query, the GROUP BY clause allows us to obtain output per employee number. In other words, if we don’t include it, then MySQL will only display an output for the first employee number as obtained by the SQL optimiser and will disregard the rest. That’s how MySQL will behave by default.

Be adding a GROUP BY clause, we designate that we want the output to be separated by employee number.

Hope this helps.
Best,
Martin


#365datascience #DataScience #data #science #365datascience #BigData #tutorial #infographic #career #salary #education #howto #scientist #engineer #course #engineer #MachineLearning #machine #learning #certificate #udemy