https://365datascience.com/create-table-tableau/ -

In our previous tutorial, we created a visualization for 2015 and expressed ‘GDP figures’ as a percentage of a total. In this tutorial, we’ll continue exploring some of Tableau’s main features. More specifically, we’ll learn how to create a table in Tableau with data and how to add some custom fields.
How to Create a Table in Tableau?
So, the table we’ll create is going to be a pretty simple one, providing a monthly and yearly breakdown of a company’s sales. We’ve already connected Tableau with a data source called “Tesla sales data”. And you can download it from here. If you are new to Tableau, or you haven’t read our previous tutorials, click here to learn how to load the file.
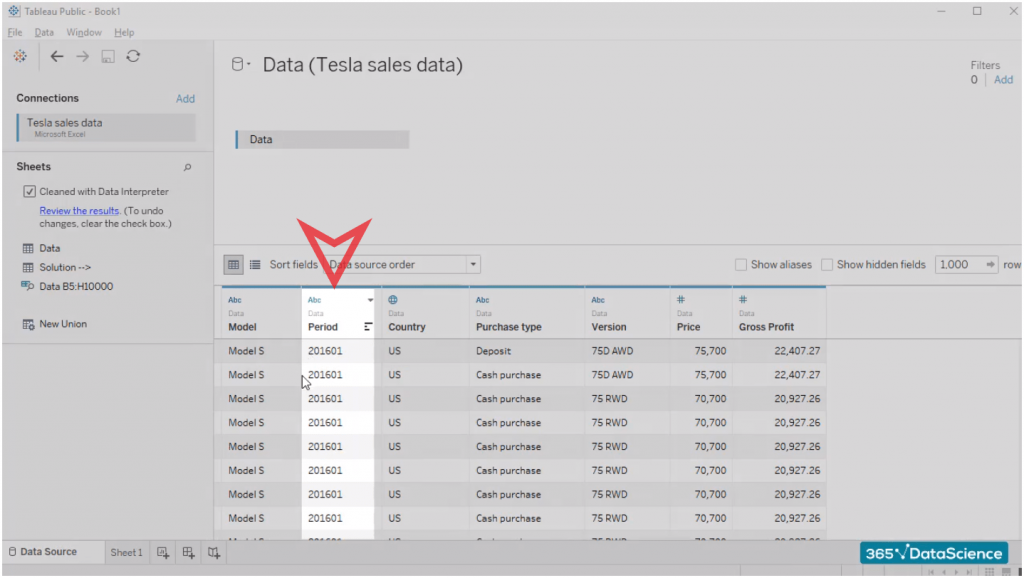
As you can see, our original data source contains a column called “Period”. This is where we have both yearly and monthly data. The first four characters designate the year a sale was made, while the last two contain information about the month when the sale occurred.
How to Create Calculated Fields in Tableau?
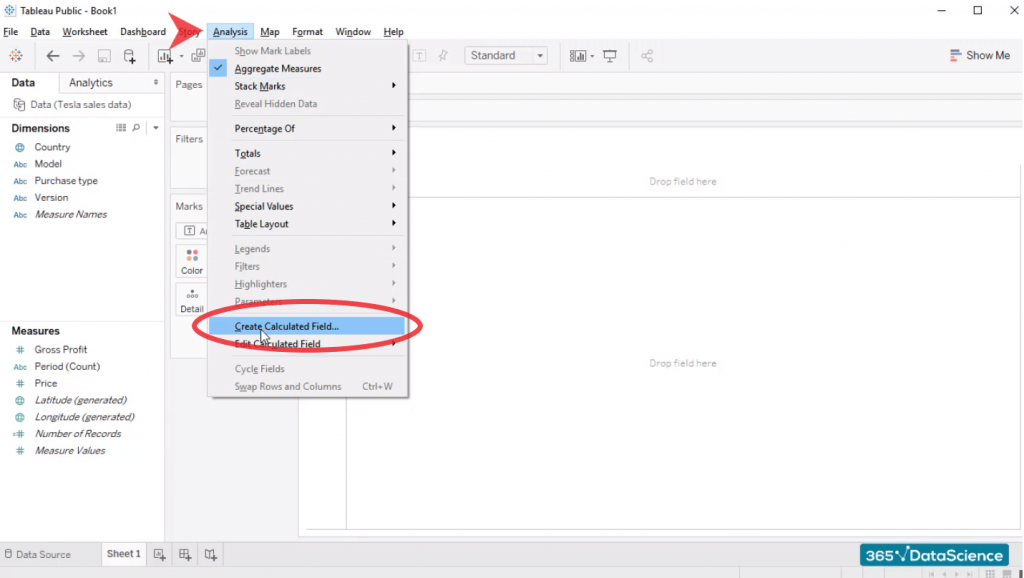
Well, what I‘d encourage you to do is split this information into two separate custom fields – “Year” and “Months”. To do that, go to the ‘Analysis’ tab and create a calculated field.
First Custom Field
Once the dialog box opens, type the name of the field you’re creating, in this case – “Year”. Then, you should use the LEFT function in order to take the four leftmost symbols of the “Period” field. This is where you have the year when the sale occurred. LEFT is a function most of you are probably familiar with. In Tableau, it works in the exact same way, as it does in Excel, for example.
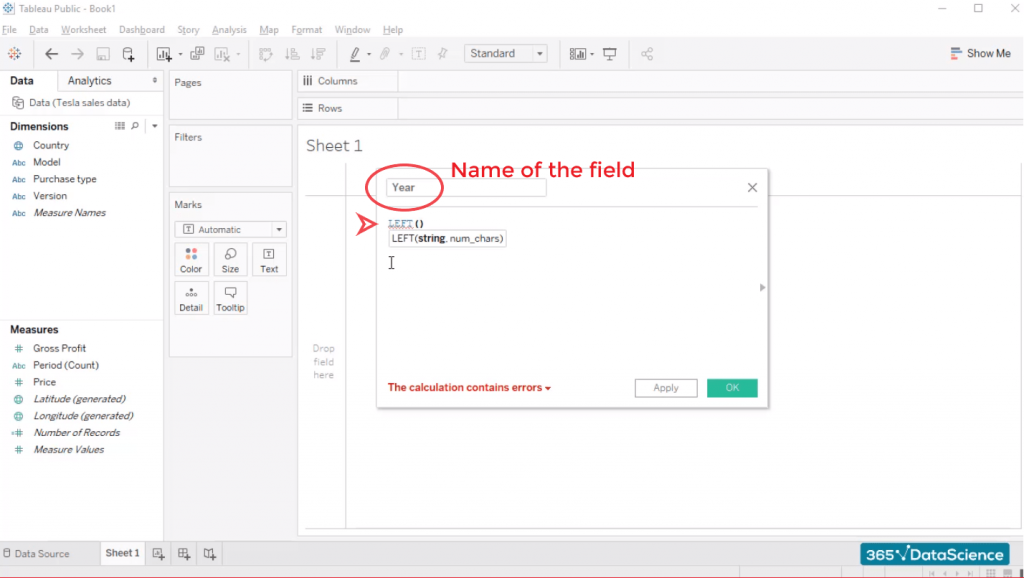
Tableau recognizes you are writing the LEFT function and it helps us with autocomplete suggestions. The LEFT function needs two arguments. The first one is a string, which in this case is the “Period” field you have in the source sheet. So, type “Period”. As you do that, Tableau will manage to recognize you’re referring to the “Period” field and will allow you to select it right away. The second component of the formula is the number of characters you’d like to extract. You’ll need four characters. And that’s what you should write here.
Just close the brackets and your new field is ready.
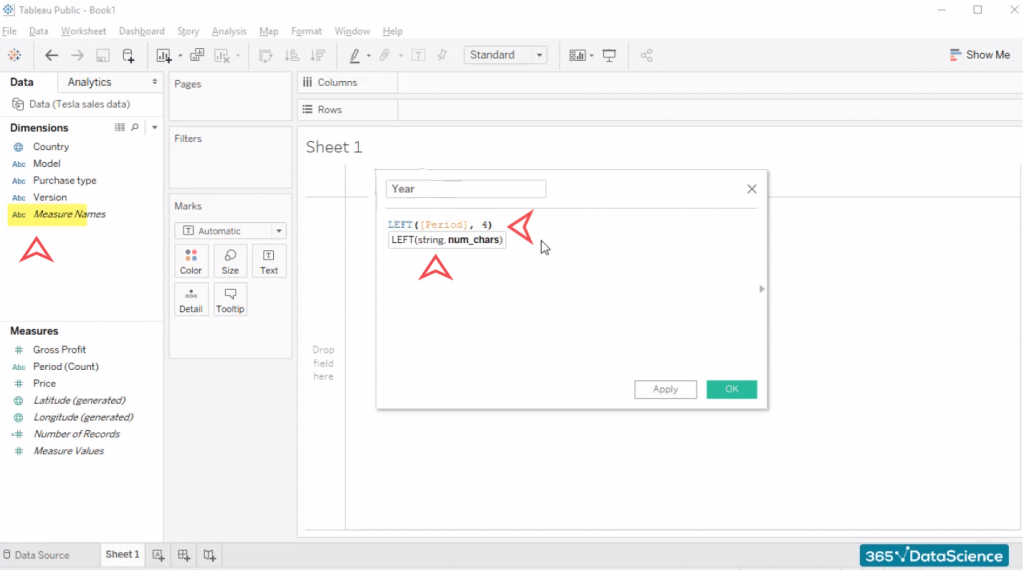
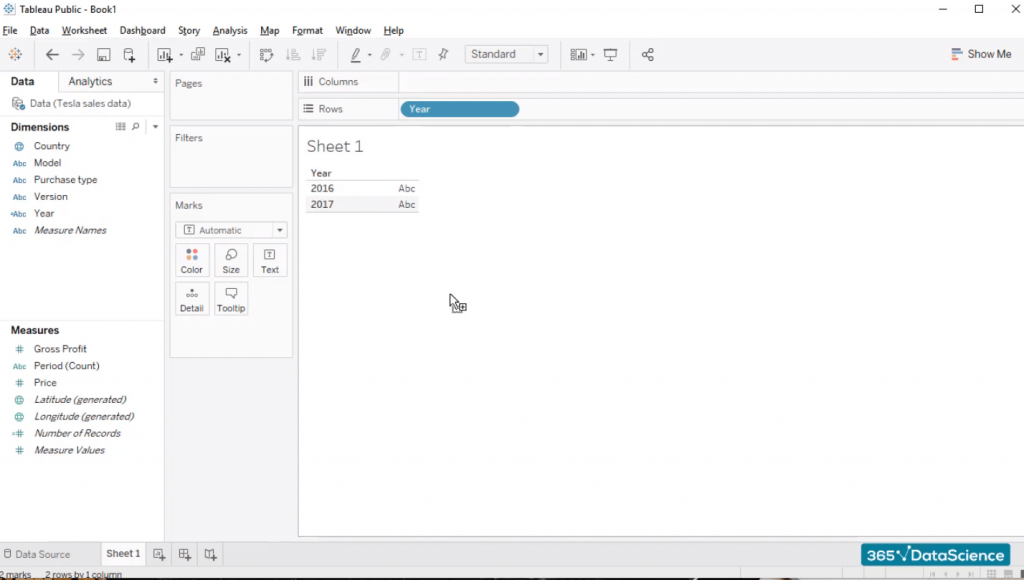
Now you can easily drag the year field into the workspace area.
Second Custom Field
The other field you need to create is “Months”. And in order to do that, you should use the RIGHT function. Again, you’ll need to go to ‘Analysis’ and create a calculated field. First, assign it with a name – “Months”. Тhen type in the RIGHT function, following the exact same procedure as before. The string you’ll need is the same (“Period”), and the number of required characters is two, given that months are the two rightmost characters within the “Period” field.
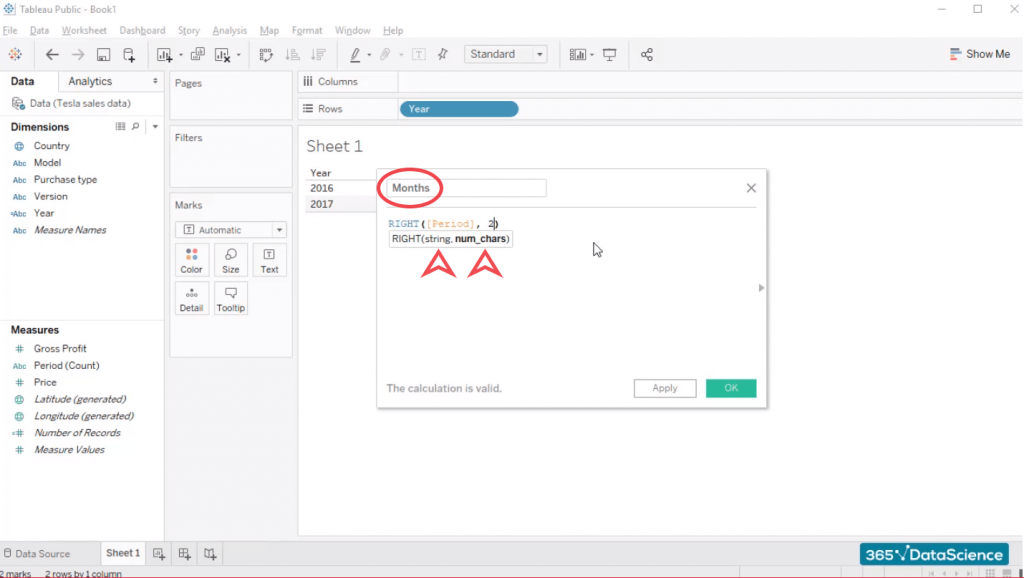
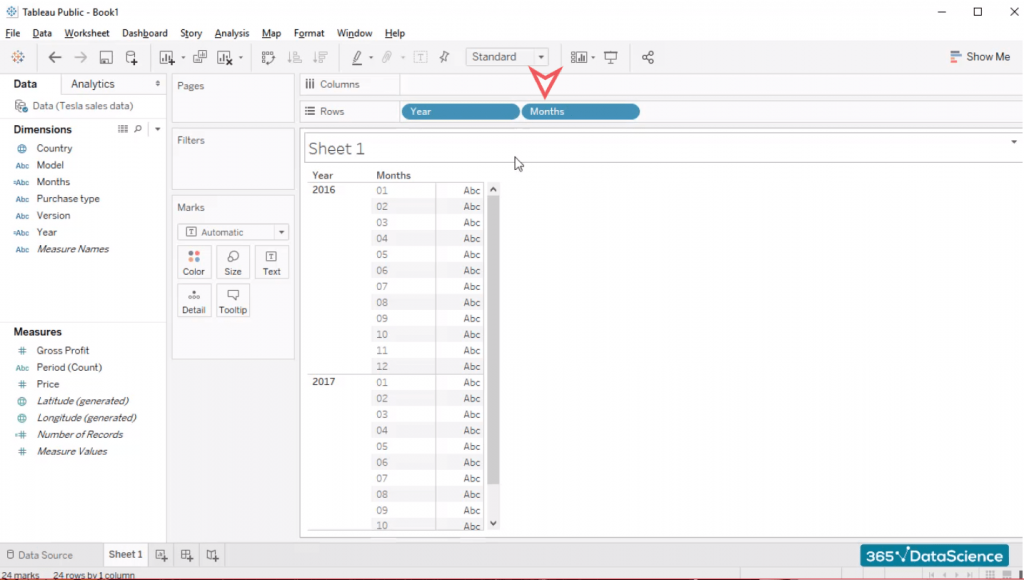
Now you have your second field – “Months”. Let’s add it right next to “Year” in the workspace area.
You can do that in two ways. You can either drag the field into the workspace area and place it right next to the years’ information, or, alternatively, drag the “Months” field right next to the “Year” field in the rows part of the screen. Either way, the output is the same.
Final touches
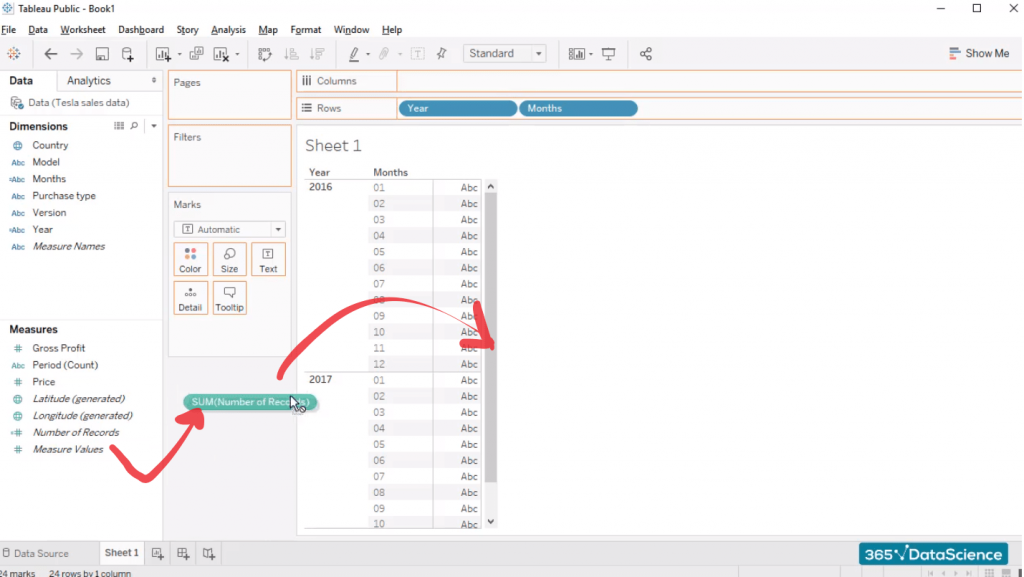
So, you’ve managed to create a table in Tableau that groups all twelve months of 2016 and all twelve months of 2017. Here’s what’s left to do. Simply insert the auto-generated field “Number of records”, which represents a simple count of the rows in the source data.
And Voila – This is How You Create a Table in Tableau
This is a nice table that shows the breakdown of the company’s total number of sales for each month in 2016 and 2017.
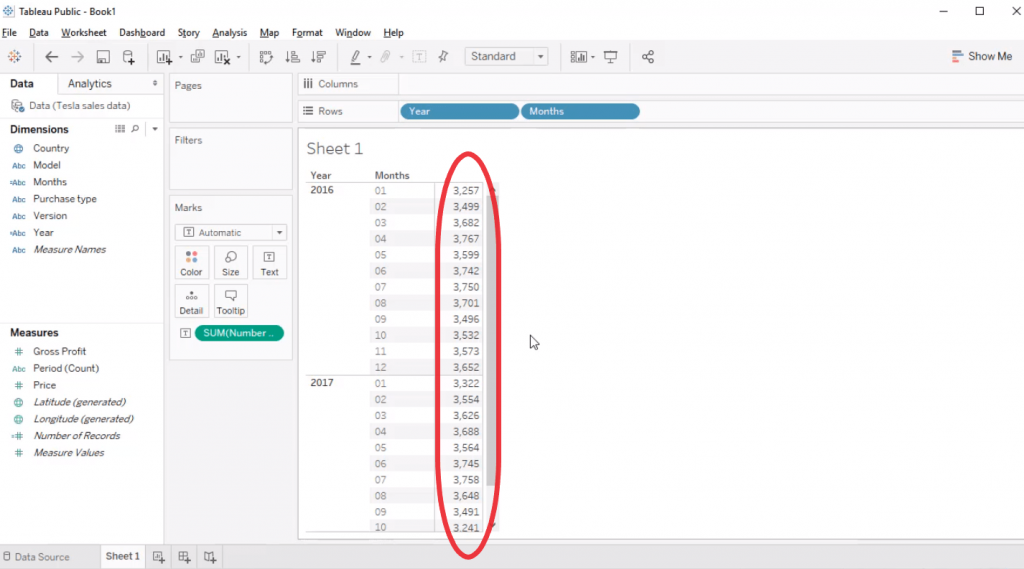
Awesome, right?
Stay tuned for more Tableau tutorials and insights into the Data Scientist’s life!
#Tableau
#365datascience #DataScience #data #science #365datascience #BigData #tutorial #infographic #career #salary #education #howto #scientist #engineer #course #engineer #MachineLearning #machine #learning #certificate #udemy

No comments:
Post a Comment