https://365datascience.com/totals-tableau/ -

Totals in Tableau
Most executives (and by most, I mean all of them), prefer to receive tables that contain totals and subtotals. This helps them digest information in a faster way. In this tutorial, you will learn how to add totals and subtotals to your Tableau tables.
Since the table we have been working on in the last few tutorials doesn’t contain totals for 2016 and 2017, we’ll add them in this tutorial.
That’s fairly easy to do.
Just go to “Analysis”, then “Totals” and select “Show column grand totals”.
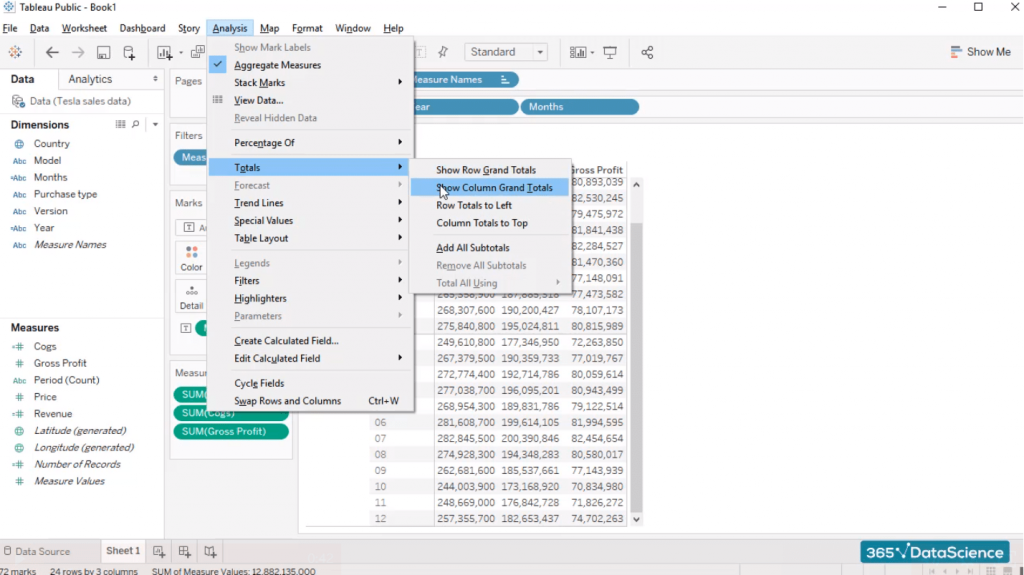
The totals we just added are for the entire period 2016 and 2017. That’s not really useful, is it? When we talk about sales or gross profit, we’re usually interested in how much a company made in a specific year, and whether it performed better than the year before. A company’s management and stakeholders will also want to know how that year’s sales compare to other companies.
So, let’s go to “Analysis”, “Totals”, and unclick the “Show column grand totals” to remove the total we just added.
What we can do differently the second time around is opt for “add all subtotals”.
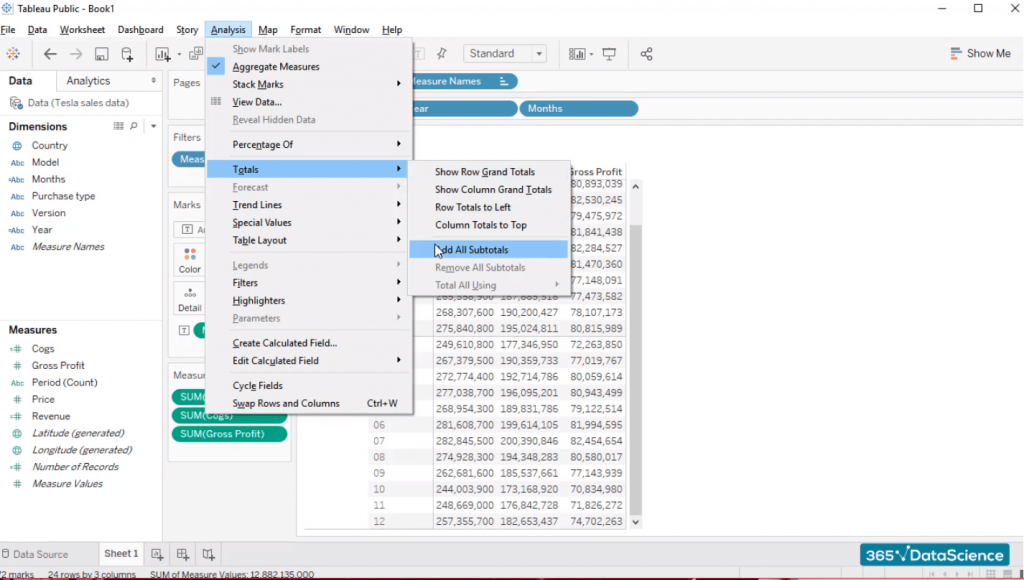
And this will give us the total figures for 2016 and 2017 separately.
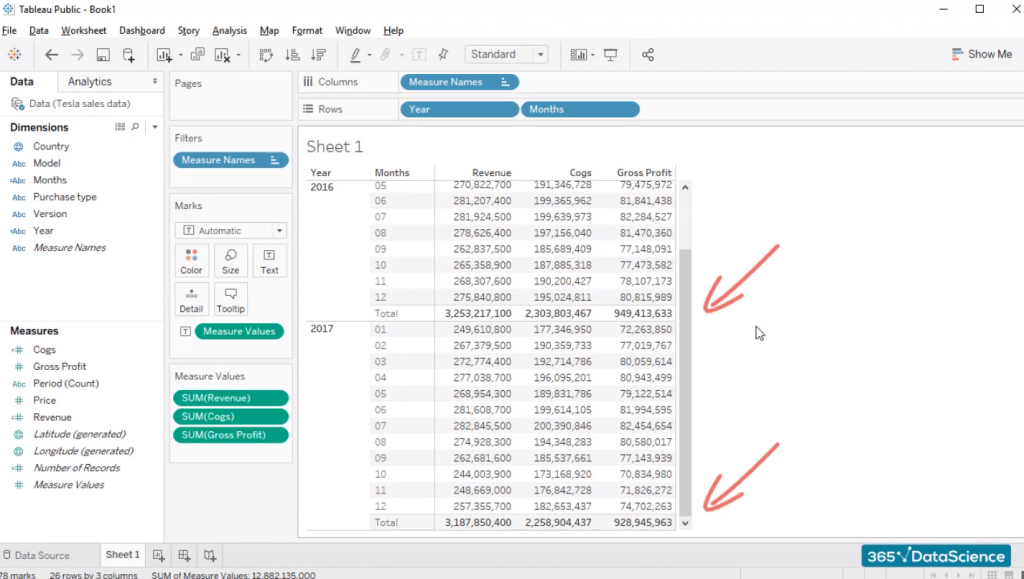
Quite nice, right?
Now you can read the table easily. The fictitious numbers you see here help us compare 2016 and 2017, and give us a good idea of what the actual sales were for that period.
The table is almost ready. We have Revenue, Cogs, and Gross Profit. Come to think about it, one thing we should probably add is a Gross Margin calculation right next to the Gross Profit figures.
Gross Margin is useful as it allows us to see what portion of revenues were converted into gross profit once we have considered the cost of goods sold.
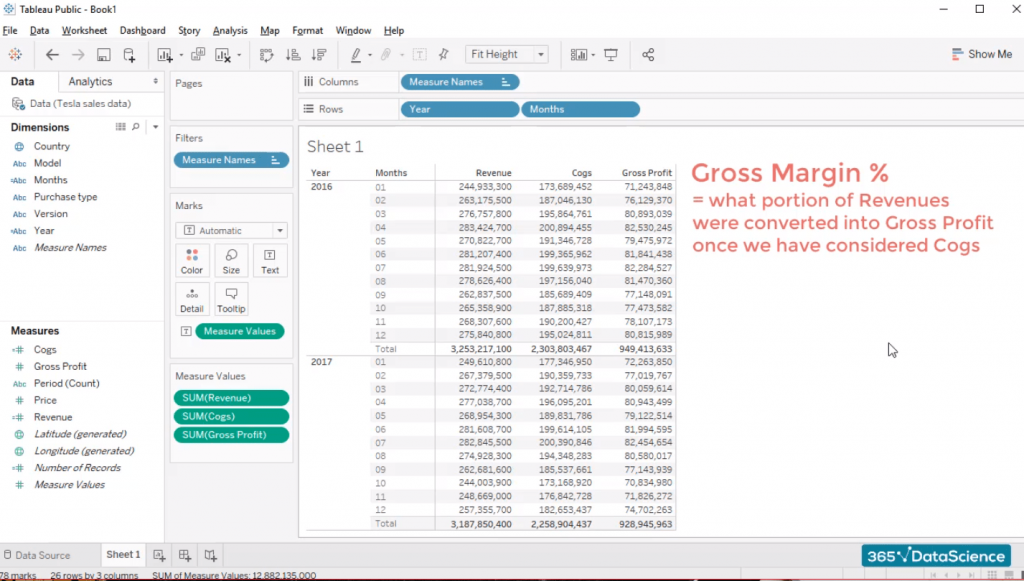
Let’s add a new calculated field and name it GM%. Now, all we have to do is divide Gross Profit by Revenue, right?
And we already know how to do that.
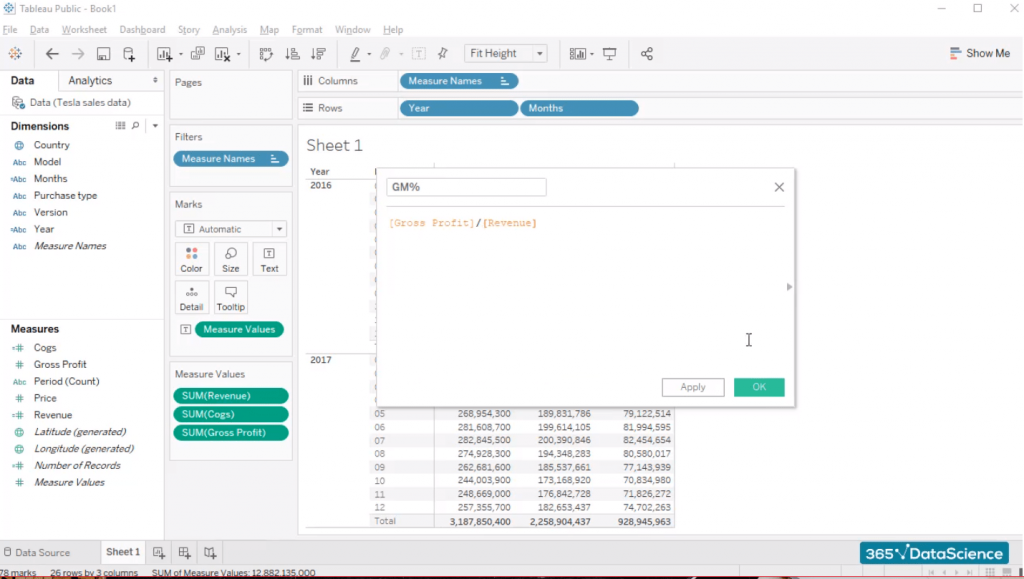
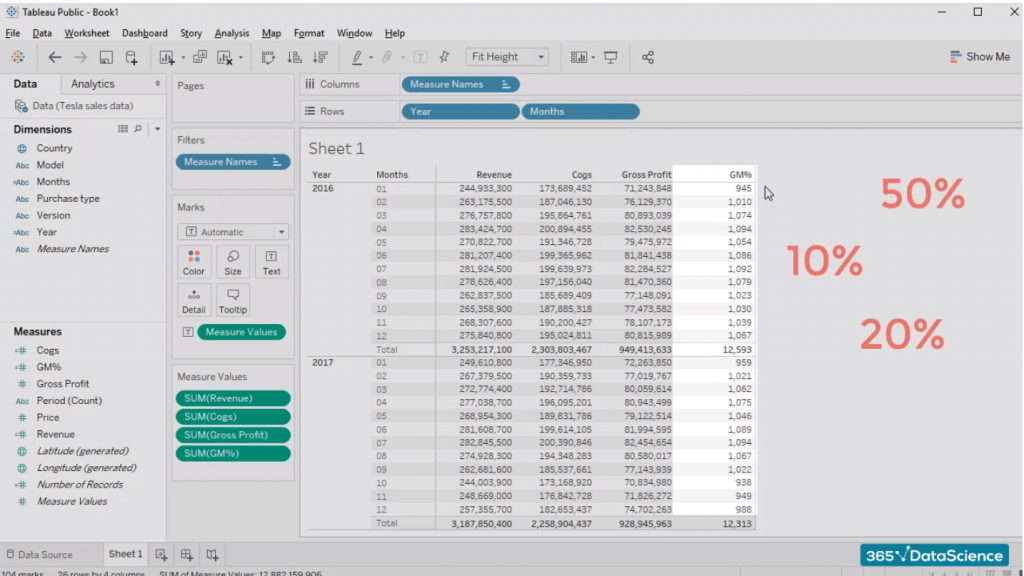
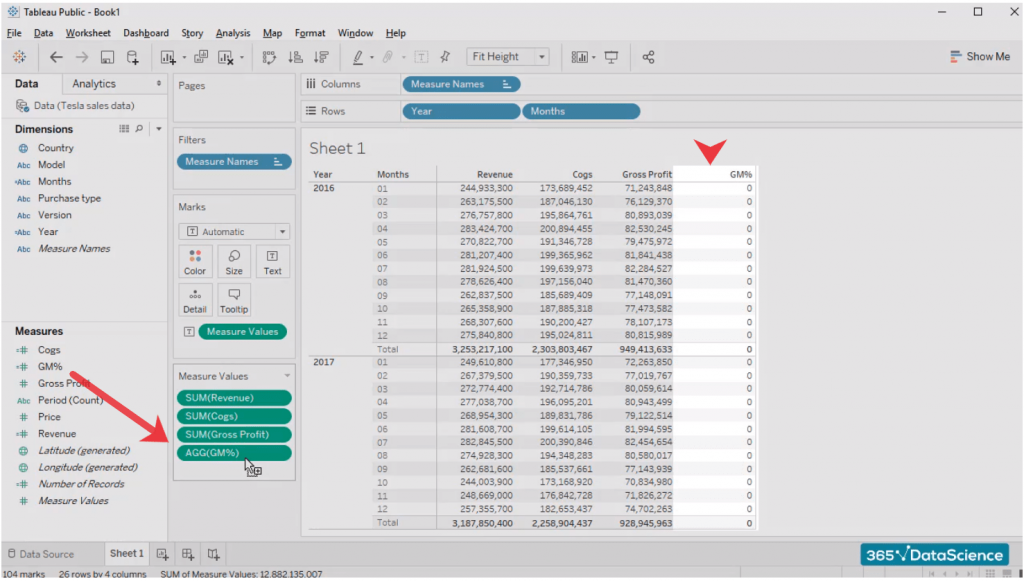
So, we’ve calculated a new field. Let’s add it to the table and insert it in the measure values card.
There. We’ve added the new field right next to Gross Profit.
But it looks strange, doesn’t it? If we divide Gross Profit by Revenues, we would usually expect a number in the region of 10, 20, 30, or maybe 50%. Certainly not 1,000. What is going on here?
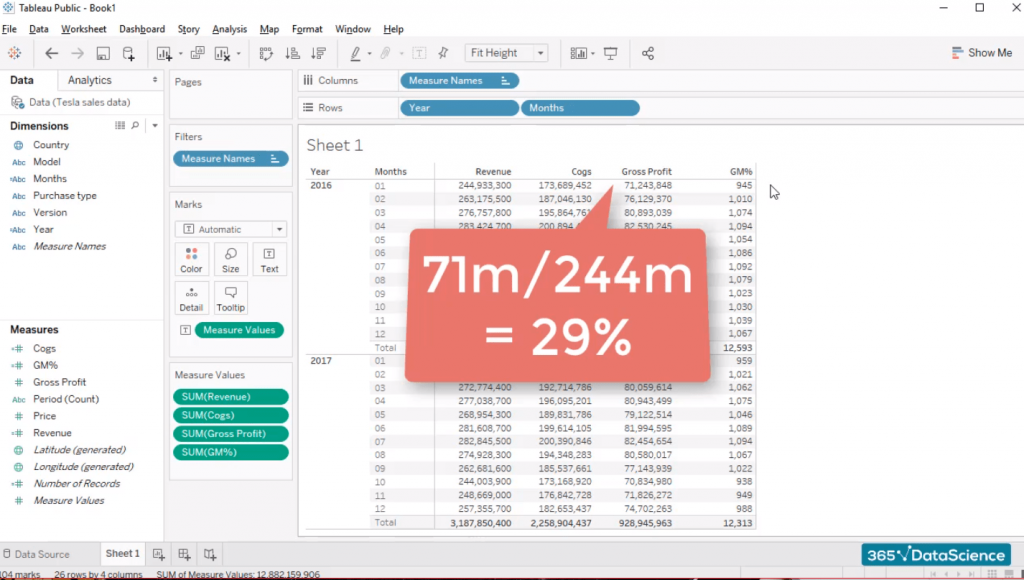
When we divide 71 million by 244 million, which is what we have in January, we obtain 29 percent approximately.
There are two possible explanations. Either Tableau miscalculated the simple division we asked it to perform, or our formula is not 100% ok. It’s most likely us and not the computer, right? We must take out the GM% field from the Measures Values box and edit it from here. So, let’s right-click on this field and edit the calculation for a second.
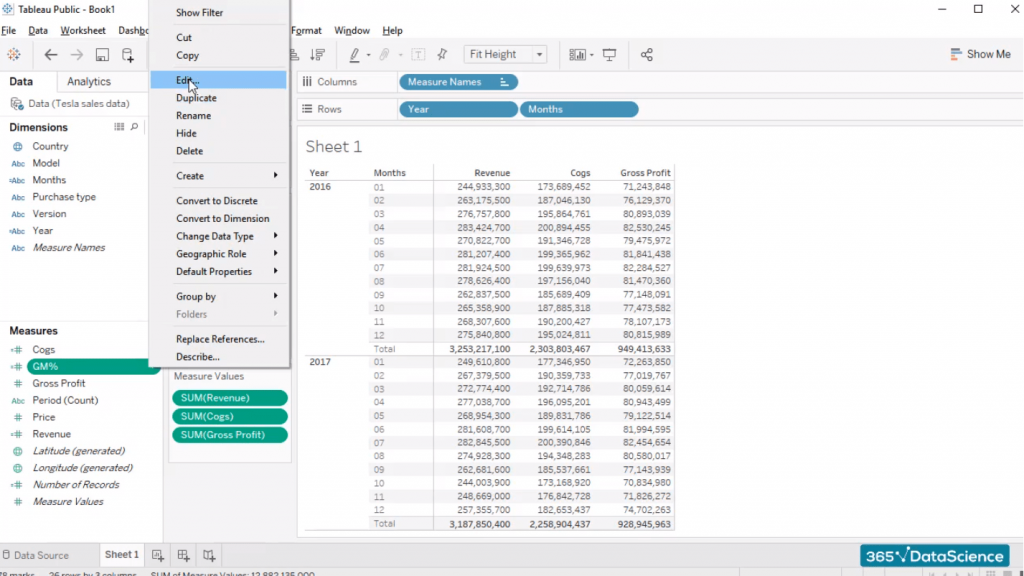
However, what we forgot to do is type “SUM” around the two variables. If we don’t sum the variables, we can’t divide their total figures for each month.
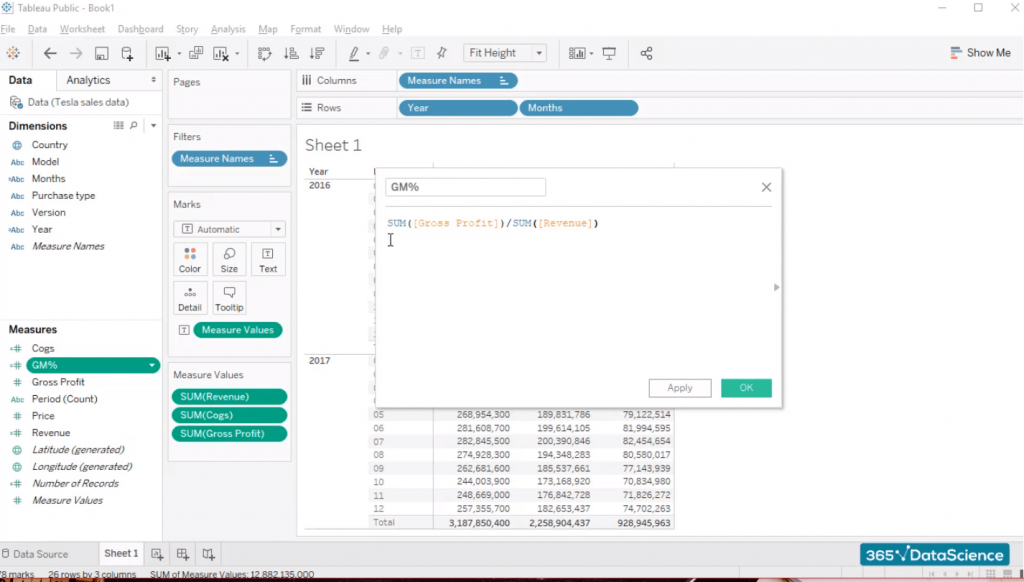
Therefore, we should adjust our calculated field and see what happens. This is a column with numbers that look like 0s. But perhaps these are percentage values. Let’s change the way the “GM%” column is displayed.
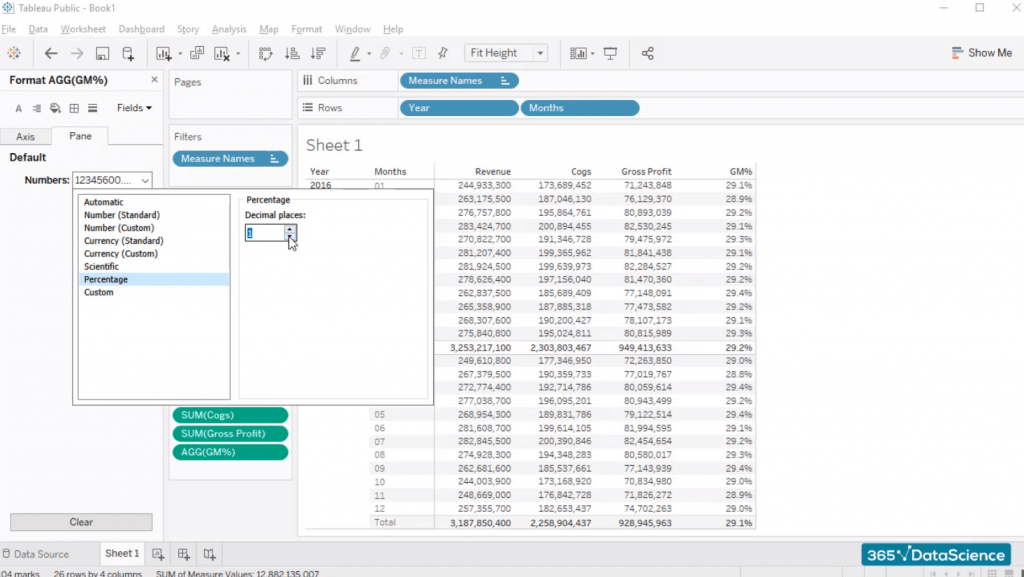
To do that, simply click on the “GM% variable” in the measure values card and select the “Format” option. We have quite a few options available here, so simply select a percentage format with one decimal place.
Voila! Our table with totals in Tableau is ready.
One of the most interesting options available in Tableau is adding a filter to the visualization you are working on. Of course, we’ll add a filter to our table. From a user’s standpoint, the only field which makes sense to be filtered in this table is the “Year” field.
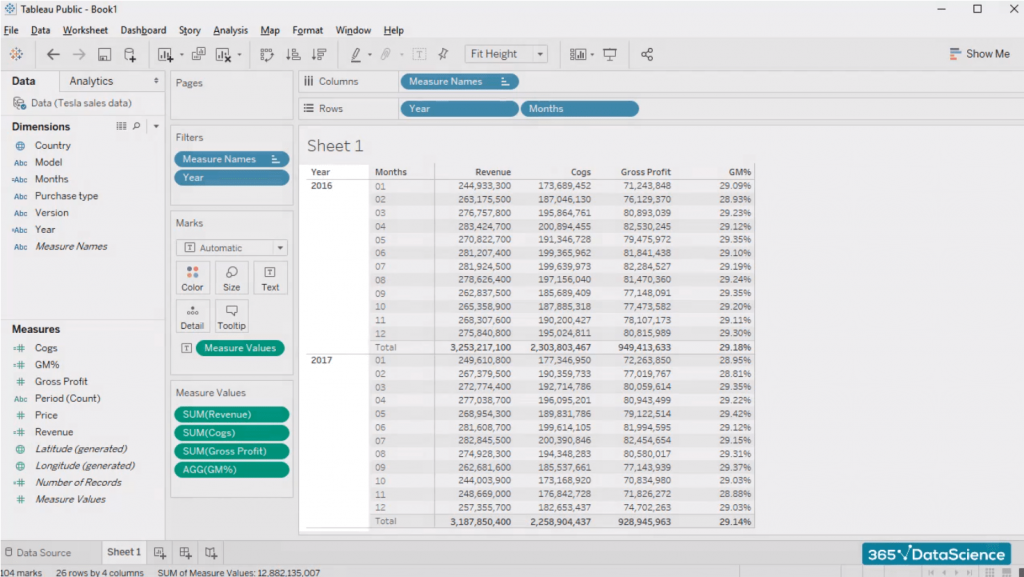
What if we’re interested in seeing numbers for 2016 or 2017 only, for example?
Well, what we can do is select the “Analysis” tab, and then select “Filters”, choosing the “year” field as we had already decided we’d like to create a filter for years.
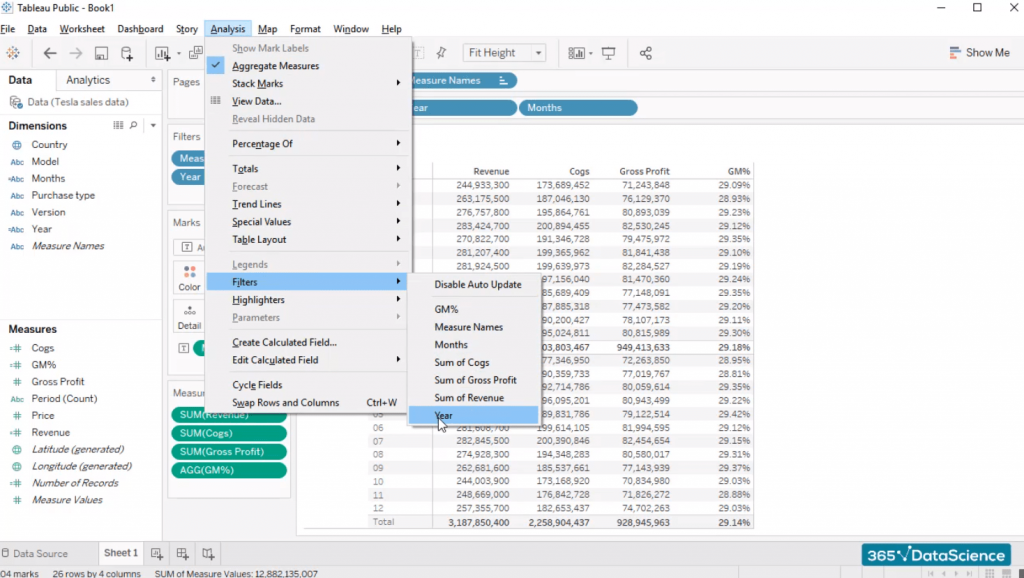
And here we are.
When we click on the tiny arrow in the upper right corner of the filter pane, we find plenty of options that allow us to adjust the filter we’ve created.
For example, we can change its appearance to:
- Single value list (representing radio buttons);
- Dropdown menu;
- Multiple values list, etc.
So, this is how you can add totals in Tableau.
If you’re eager to polish your Tableau skills, don’t miss out on the rest of our Tableau tutorials, such as Tableau versus Excel, How to Connect Data Sources to Tableau, Navigating through Tableau’s Interface, Connecting SQL and Tableau, and more!
#365datascience #DataScience #data #science #365datascience #BigData #tutorial #infographic #career #salary #education #howto #scientist #engineer #course #engineer #MachineLearning #machine #learning #certificate #udemy

No comments:
Post a Comment